INFOPlease contact support@datafold.com if you’d like to enable this feature for your organization.
- You have (or plan to have) 100s or 1000s of monitors
- Your team is accustomed to managing things in code
- Strict governance and change management are important to you
Getting started
INFOThis section describes how to get started with GitHub Actions, but the same concepts apply to other hosted version control platforms like GitLab and Bitbucket. Contact us if you need help getting started.
Set up version control integration
To start using monitors as code, you’ll need to decide which repository will contain your YAML configuration. If you’ve already connected a repository to Datafold, you could use that. Or, follow the instructions here to connect a new repository.Generate a Datafold API key
If you’ve already got a Datafold API key, use it. Otherwise, you can create a new one in the app by visiting Settings > Account and selecting Create API Key.Create monitors config
In your chosen repository, create a new YAML file where you’ll define your monitors config. For this example, we’ll name the filemonitors.yaml and place it in the root directory, but neither of these choices are hard requirements.
Leave the file blank for now—we’ll come back to it in a moment.
Add CI workflow
If you’re using GitHub Actions, create a new YAML file under.github/workflows/ using the following template. Be sure to tailor it to your particular setup:
Create a monitor
Now return to your YAML configuration file to add your first monitor. Reference the list of examples below and select one that makes sense for your organization.Examples
INFOThese examples are intended to serve as inspiration and don’t demonstrate every possible configuration. Contact us if you have any questions.
Data Diff
Data Diff monitors detect differences between any two datasets, within or across databases.Metric
Metric monitors identify anomalies in standard metrics like row count, freshness, and cardinality, or in any custom metric.Supported metrics
For more details on supported metrics, see the docs for Metric monitors. Table metrics:- Freshness:
freshness - Row Count:
row_count
- Cardinality:
cardinality - Uniqueness:
uniqueness - Minimum:
minimum - Maximum:
maximum - Average:
average - Median:
median - Sum:
sum - Standard Deviation:
std_dev - Fill Rate:
fill_rate
Data Test
Data Test monitors validate your data with business rules and surface specific records that fail your tests.Schema Change
Schema Change monitors detect when changes occur to a table’s schema.Bulk Manage with Wildcards
For certain monitor types—Freshness, Row Count, and Schema Change—it’s possible to create/manage many monitors at once using the following wildcard syntax:include_tables and exclude_tables to fine-tune your selection.
FAQ
Can I still create/manage monitors in the app if I'm using monitors as code?
Can I still create/manage monitors in the app if I'm using monitors as code?
Yes, it’s not all or nothing. You can still create/manage monitors in the app even if you’re defining others in code.
What happens to a monitor in the app if it's removed from the code?
What happens to a monitor in the app if it's removed from the code?
By default, nothing—it remains in the app. However, you can add the Note: this only applies to monitors that were created from code, not those created in the UI.
--dangling-monitors-strategy [delete|pause] flag to your run command to either delete or pause notifications if they’re removed from your code. For example:How do I delete or pause all of my monitors?
How do I delete or pause all of my monitors?
Add the Note that providing an empty YAML file will likely produce an error and not have the same effect.
--dangling-monitors-strategy [delete|pause] flag to your run command and replace the contents of your YAML file with the following:Can I use the app to modify monitors managed in code?
Can I use the app to modify monitors managed in code?
No, any monitors created from code will be read-only in the app (though they can still be cloned).
Can I export monitors I've created in the app so I can manage them in code?
Can I export monitors I've created in the app so I can manage them in code?
Yes, you can export all monitors from the app to manage them as code. There are two ways to do this: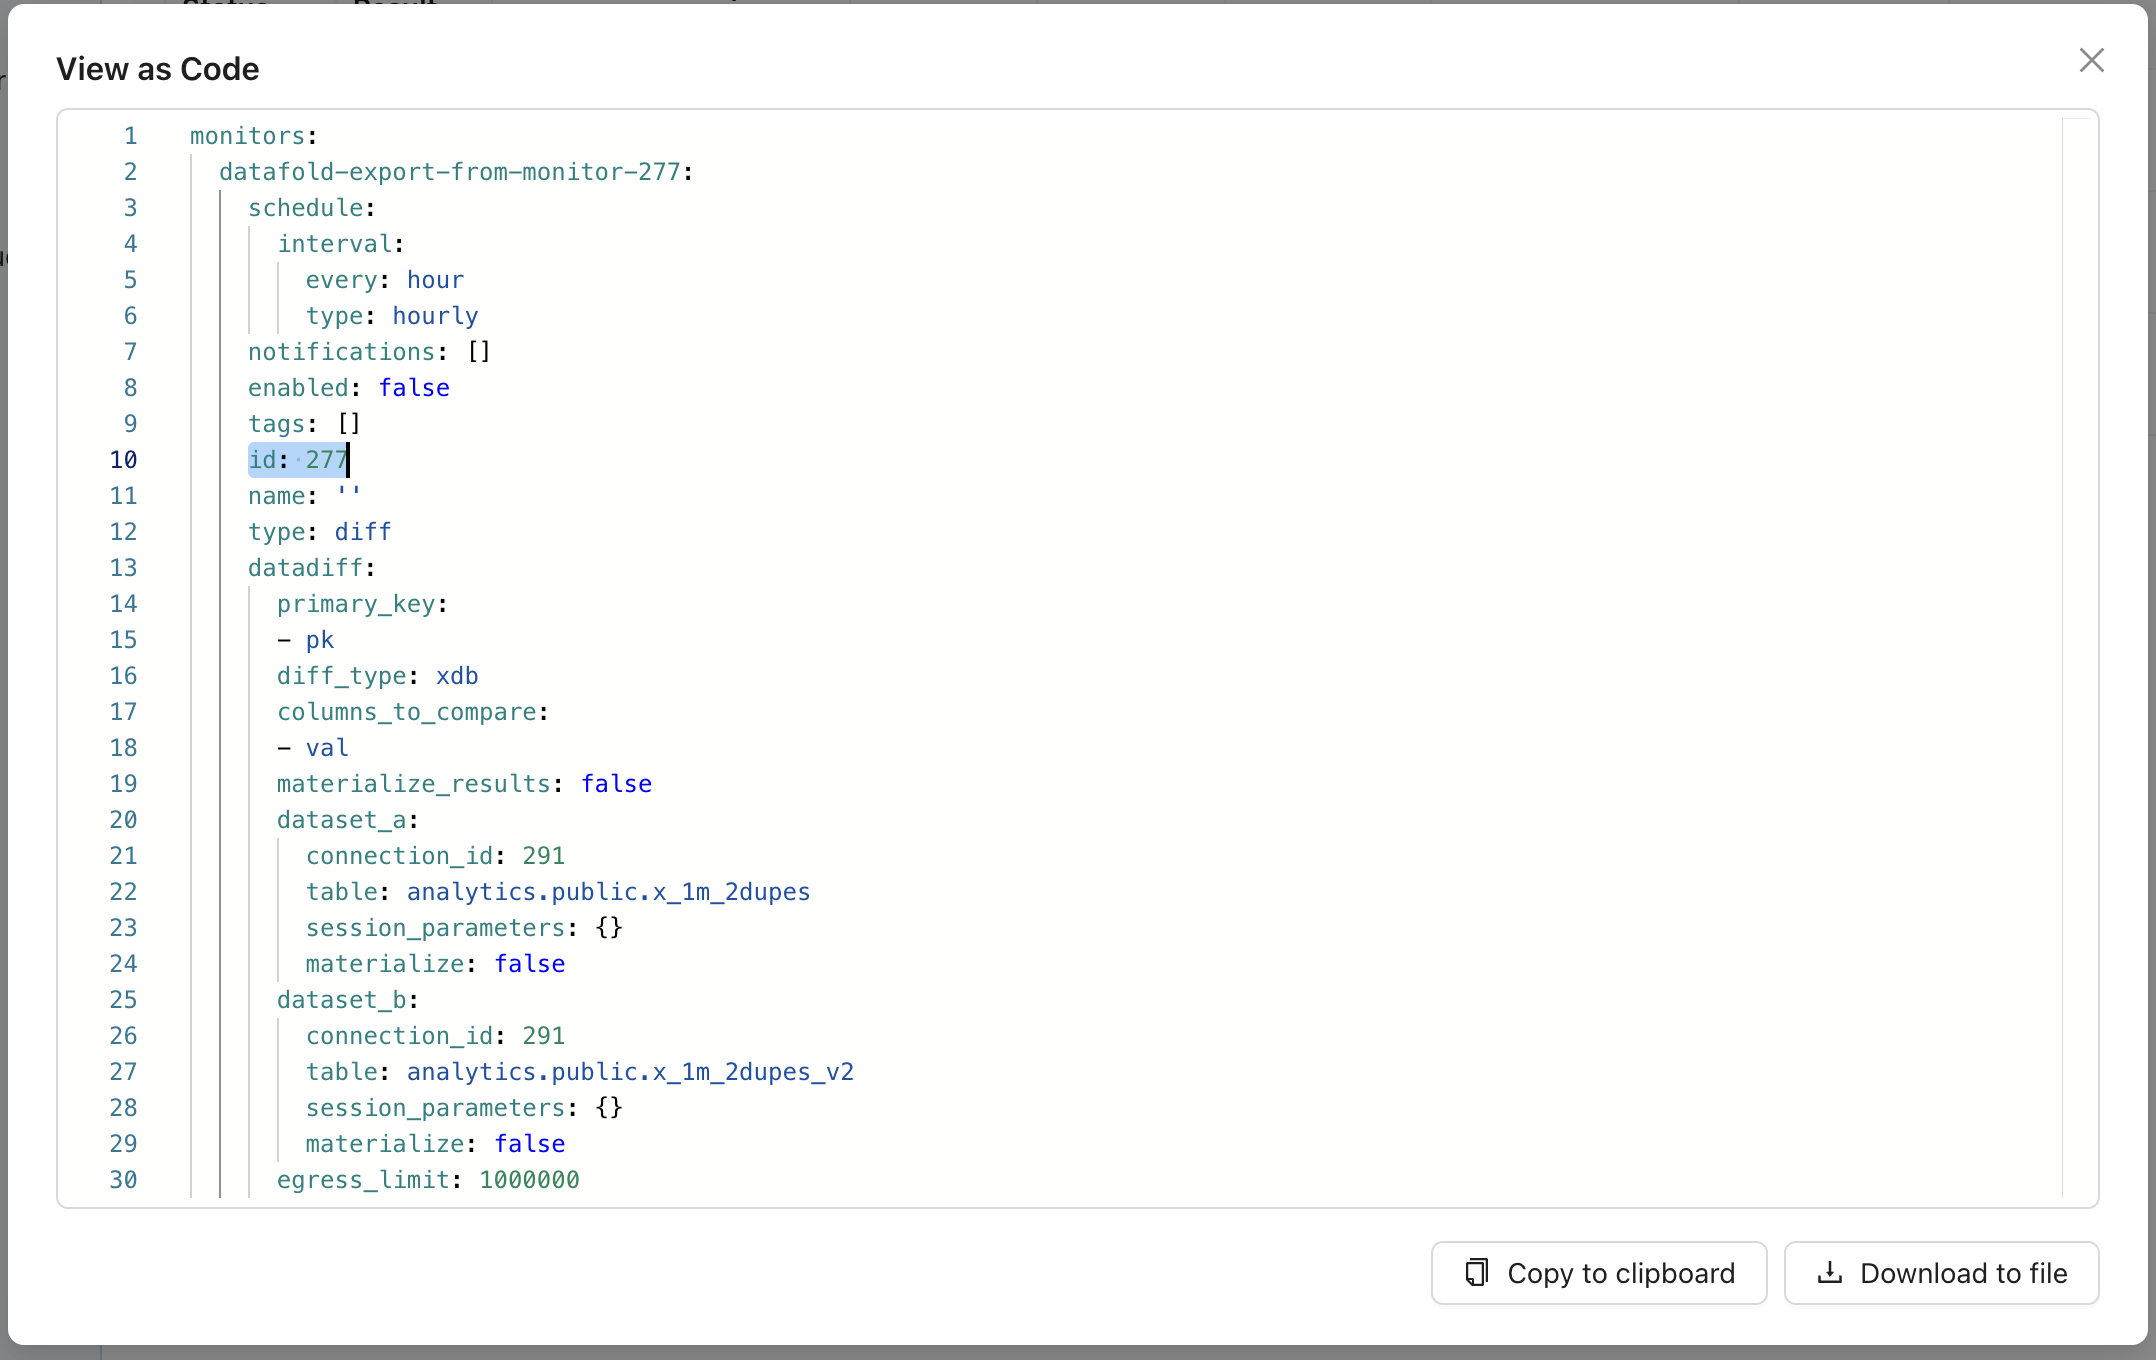
- Exporting all monitors: Navigate to the Monitors list page and click the View as Code button
- Exporting a single monitor: Go to the specific monitor and click Actions and then select View as Code
id field in the YAML. If you want to preserve monitor history, keep the id field as this will update the original monitor to be managed as code. If you don’t want to preserve your monitor history, delete the id field to create a new monitor as code while keeping the original monitor intact.