Data App Lineage Overview
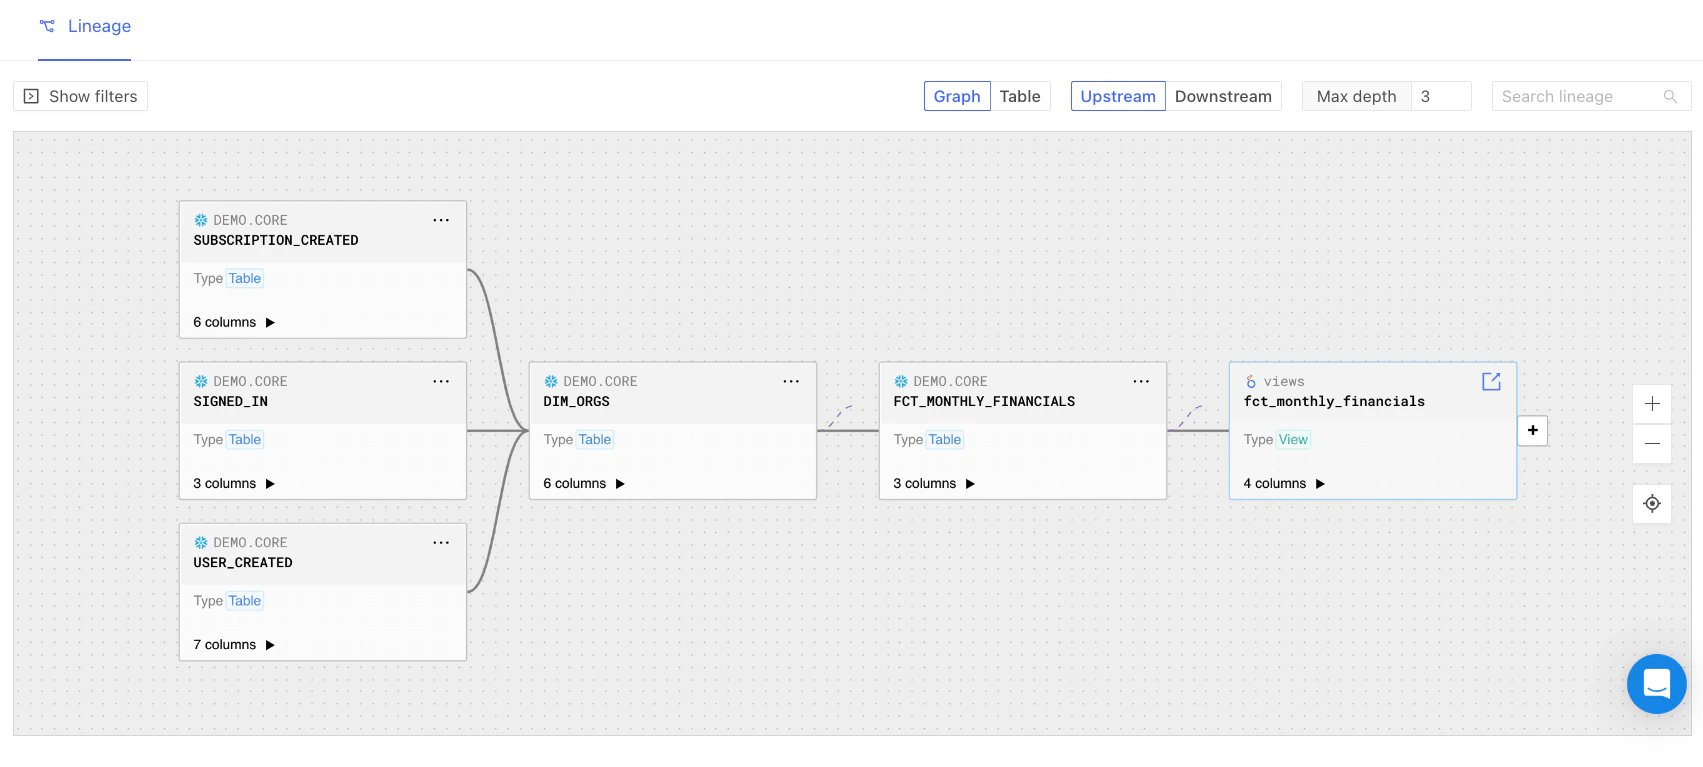
Lineage Graph
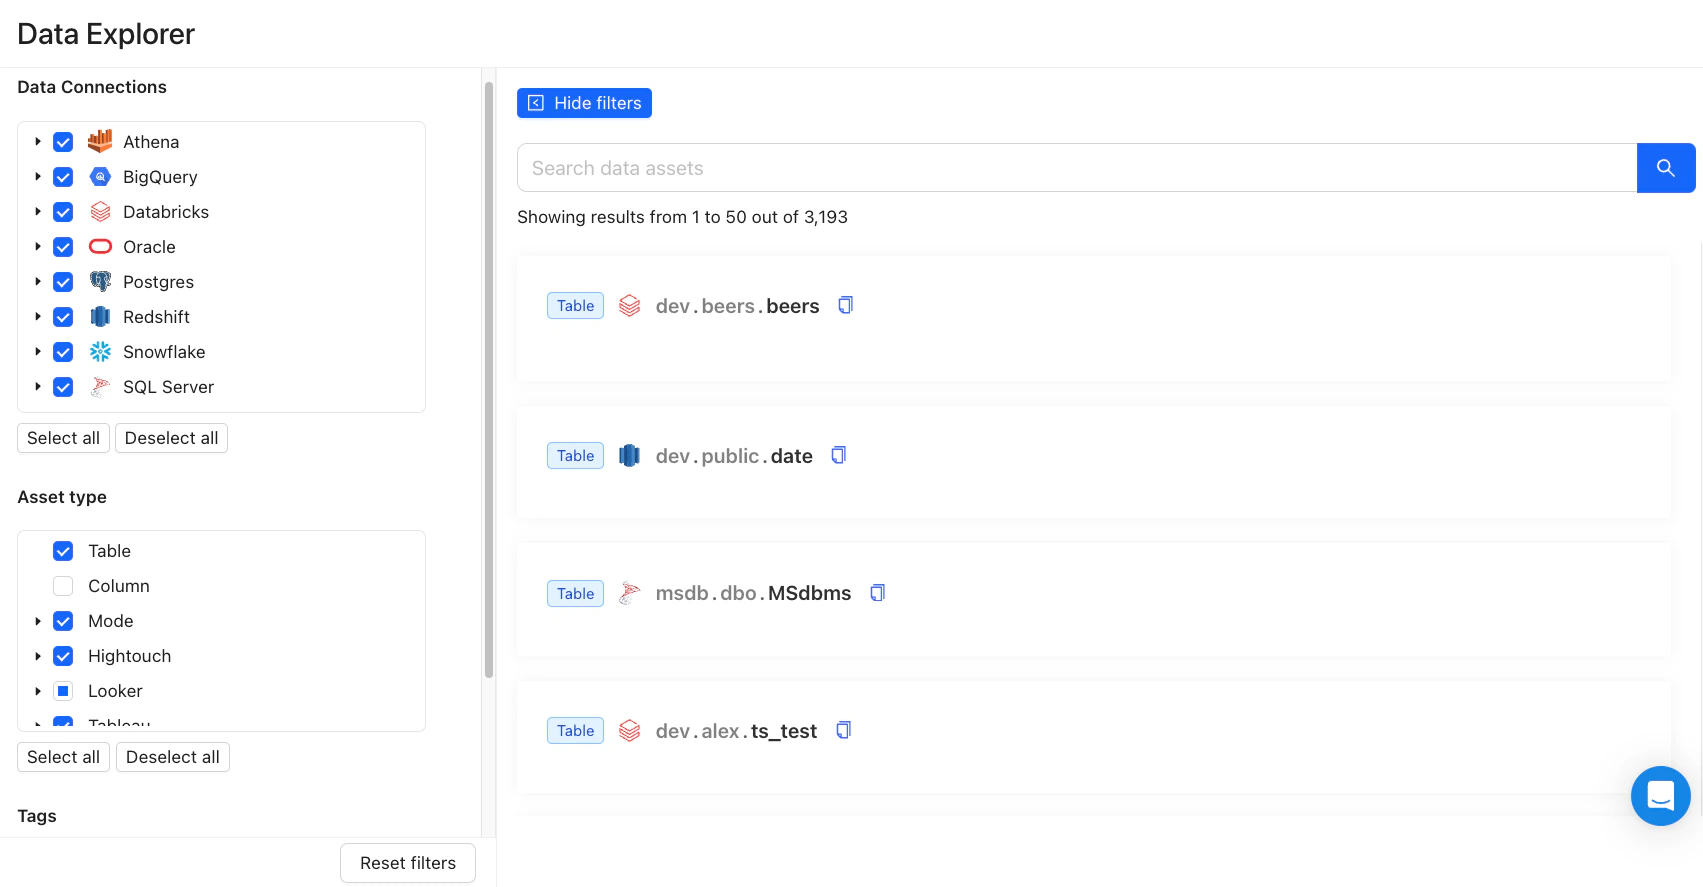
Datafold’s Data Knowledge Graph maps your entire data ecosystem — lineage, business logic, usage, and ontology — providing essential context to your AI agents via MCP and helping you understand the impact of changes across systems.
Data App Lineage Overview
Lineage Graph