Dataset
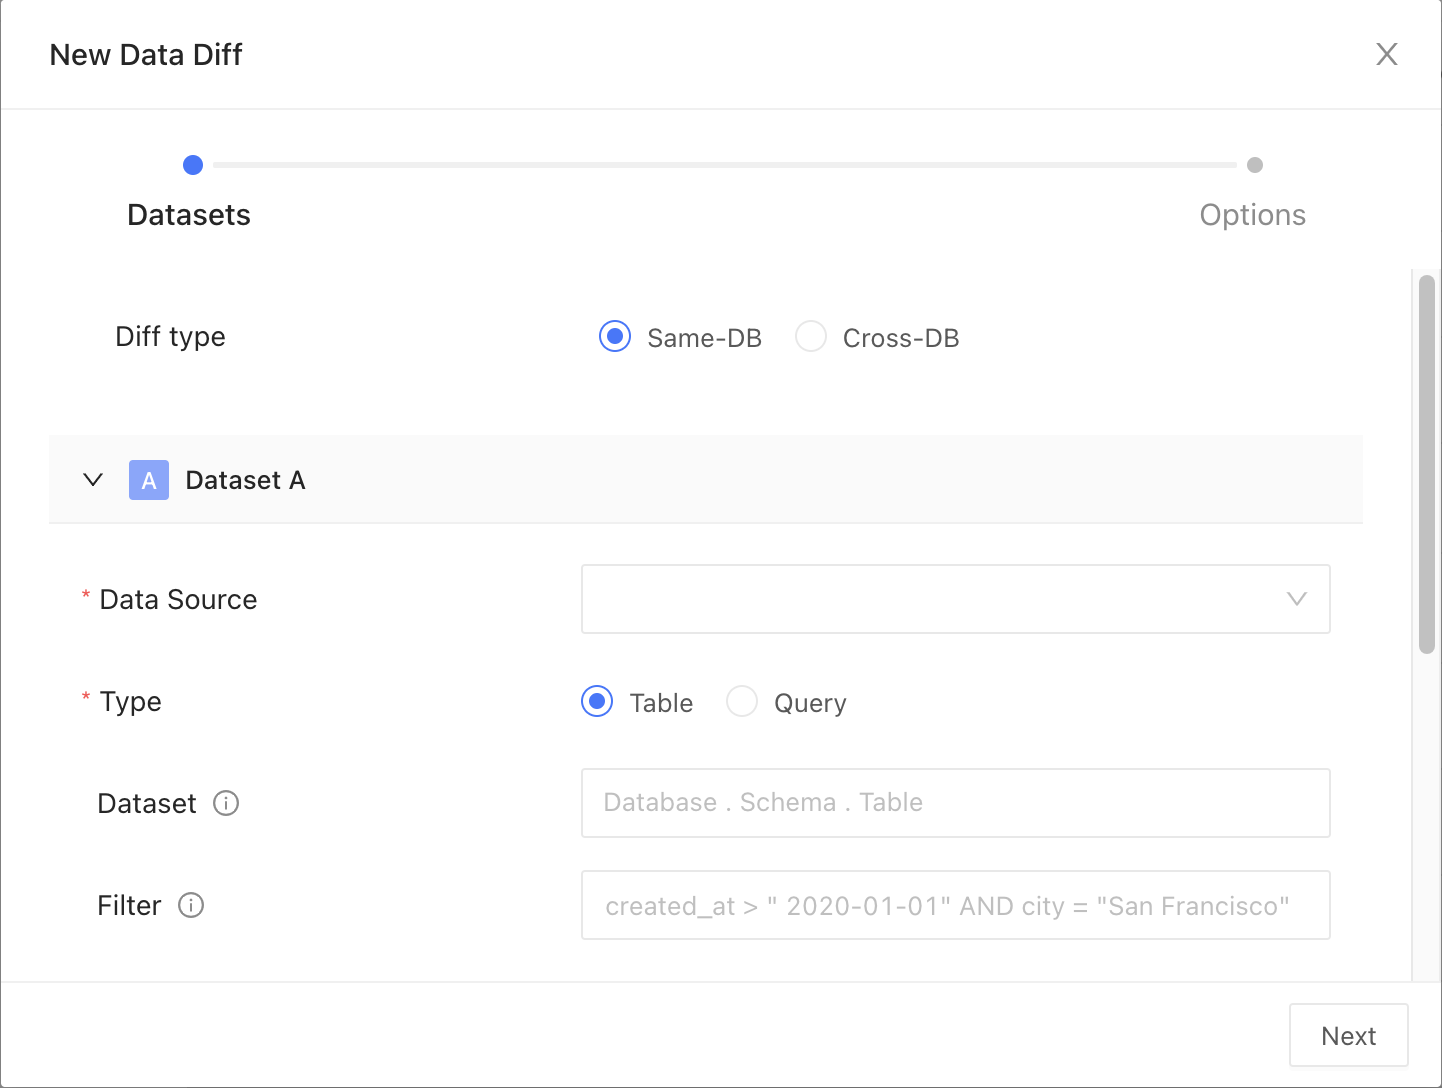
Data connection
Pick your data connection(s).Diff type
Choose how you want to compare your data:- Table: Select this to compare data directly from database tables
- Query: Use this to compare results from specific SQL queries
Dataset
Choose the dataset you want to compare, Main and Test. This can be a table or a view in your relational database.Time travel point
If your database supports time travel, like Snowflake, you can query data at a specified timestamp. This is useful for tracking changes over time, conducting audits, or correcting mistakes from accidental data modifications. You can adjust the database’s session parameters as needed for your query. Supported time travel expressions:
Timestamp examples:
2024-01-012024-01-01 10:04:232024-01-01 10:04:23-09:002024-07-16T10:04:23+05:00
1303600
Filter
Insert your filter clause after theWHERE keyword to refine your dataset. For example: created_at >'2000-01-01 will only include data created after January 1, 2000.
Column remapping
When columns are the same data type but are named differently, column remapping allows you to align and compare them. This is useful when datasets have semantically identical columns with different names, such asuserID and user_id. Datafold will surface any differences under the column name used in the Main dataset.
General parameters
Primary key
The primary key is one or more columns used to uniquely identify a row in the dataset during diffing. The primary key (or keys) does not need to be formally defined in the database or elsewhere as it is used for unique row identification during diffing. Multiple columns support compound primary key definitions.Time-series dimension column
If a time-series dimension is selected, this produces a Timeline plot of diff results over time to identify any time-based patterns. This is useful for identifying trends or anomalies when a given column does not match between tables in a certain date range. By selecting a time-based column, you can visualize differences and patterns across time, measured as column match rates.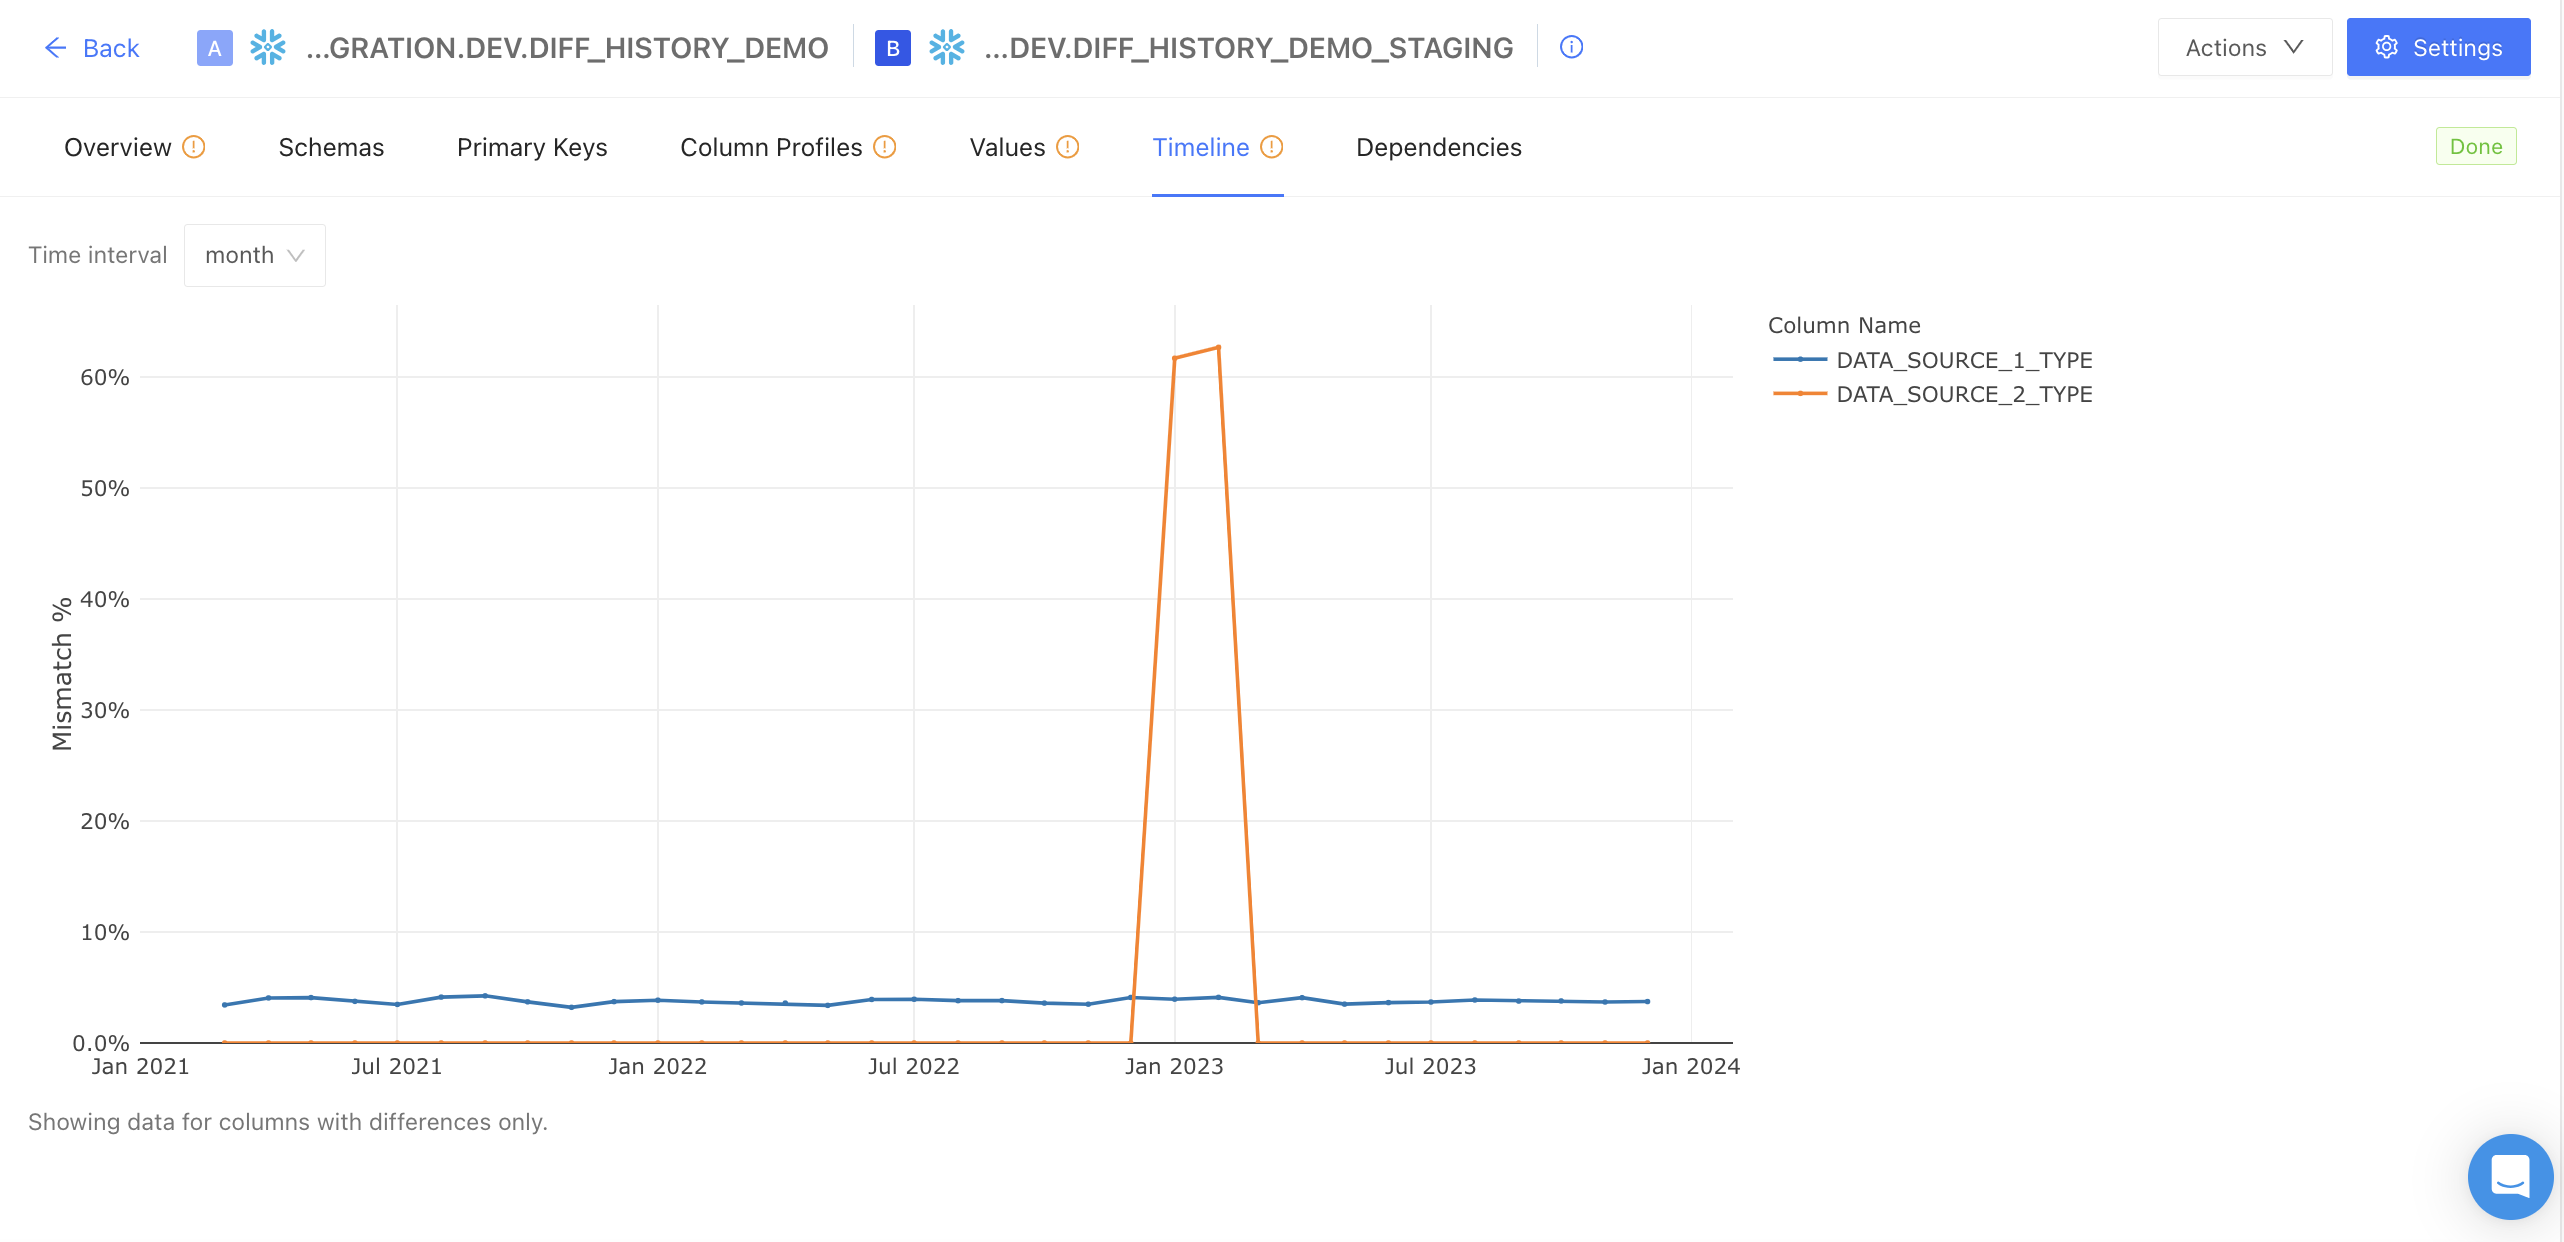
Materialize diff results to table
Create a detailed table from your diff results, indicating each row where differences occur. This table will include corresponding values from both datasets and flags showing whether each row matches or mismatches.Materialize full diff result
For in-depth analysis, you can opt to materialize the full diff result. This disables sampling, allowing for a complete row-by-row comparison across datasets. Otherwise, Datafold defaults to diffing only a sample of the data.Row sampling
Enable sampling
Use this to compare a subset of your data instead of the entire dataset. This is best for assessing large datasets.Sampling tolerance
Sampling tolerance defines the allowable margin of error for our estimate. It sets the acceptable percentage of rows with primary key errors (like nulls, duplicates, or primary keys exclusive to one dataset) before disabling sampling. When sampling is enabled, not every row is examined, which introduces a probability of missing certain discrepancies. This threshold represents the level of difference we are willing to accept before considering the results unreliable and thereby disabling sampling. It essentially sets a limit on how much variance is tolerable in the sample compared to the complete dataset. Default: 0.001%Sampling confidence
Sampling confidence reflects our level of certainty that our sample accurately represents the entire dataset. It represents the minimum confidence level that the rate of primary key errors is below the threshold defined in sampling tolerance. To put it simply, a 95% confidence level with a 5% tolerance means we are 95% certain that the true value falls within 5% of our estimate. Default: 99%Sampling threshold
Sampling is automatically disabled when the total row count of the largest table in the comparison falls below a specified threshold value. This approach is adopted because, for smaller datasets, a complete dataset comparison is not only more feasible but also quicker and more efficient than sampling. Disabling sampling in these scenarios ensures comprehensive data coverage and provides more accurate insights, as it becomes practical to examine every row in the dataset without significant time or resource constraints.Sample size
This provides an estimated count of the total number of rows included in the combined sample from Datasets A and B, used for the diffing process. It’s important to note that this number is an estimate and can vary from the actual sample size due to several factors:- the presence of duplicate primary keys in the datasets will likely increase this estimate, as it inflates the perceived uniqueness of rows
- applying filters to the datasets tends to reduce the estimate, as it narrows down the data scope
- The number of rows we sample is not fixed; instead, we use a statistical approach called the Poisson distribution. This involves picking rows randomly from an infinite pool of rows with uniform random sampling. Importantly, we don’t need to perform a full diff (compare every single row) to establish a baseline.
- sampling tolerance: 5%
- sampling confidence: 95%
Tolerance for floats
An acceptable delta between numeric values is used to determine if they match. This is particularly useful for addressing rounding differences in long floating-point numbers. Add tolerance by choosing a column name, mode, and value. For mode:- Relative: Defines a percentage-based tolerance. For example, a 2% relative tolerance means no difference is noted if the absolute value of (A/B - 1) is less than or equal to 2%.
- Absolute: Sets a fixed numerical margin. For instance, an absolute tolerance of 0.5 means values are matched if the absolute difference between A and B is 0.5 or less.