Overview
Match Score
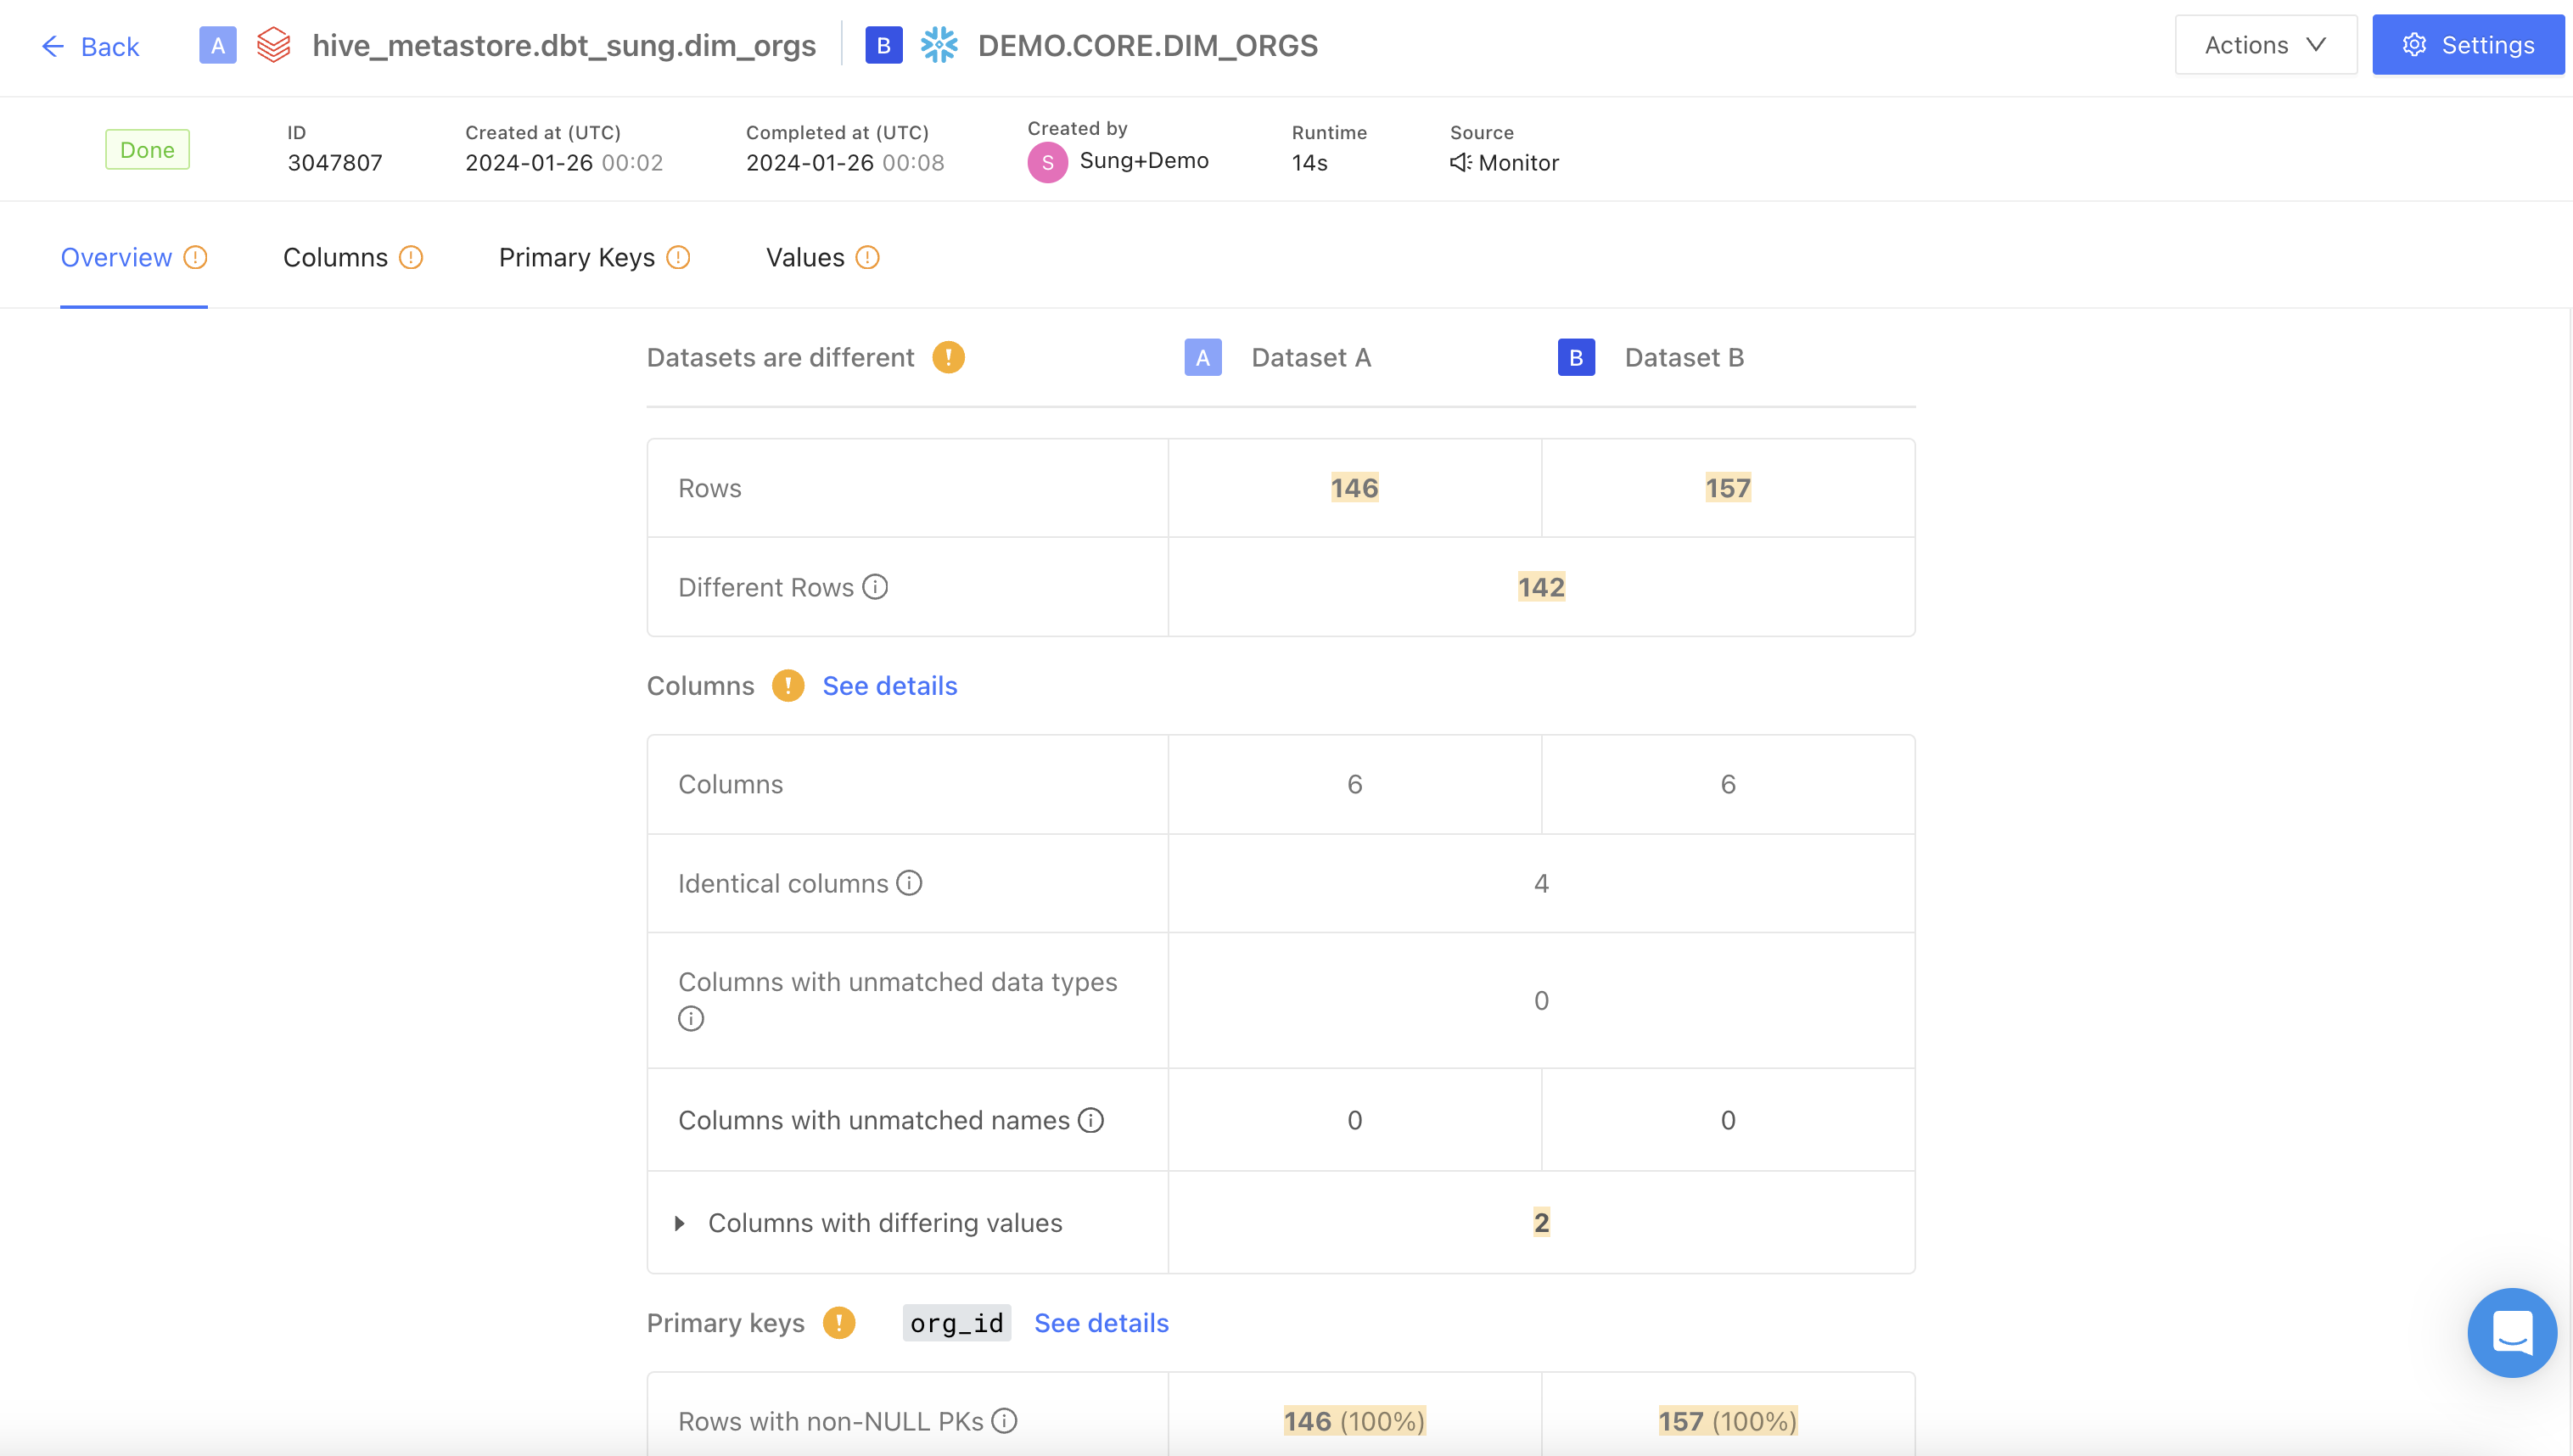
The Match Score is the percentage shown in the Overview tab. It summarizes how similar the two datasets are across rows, columns, and values in a single number between 0% and 100%.Formula
Value differences are multiplied by 2 because each differing cell is counted once on Table A’s side of the denominator and once on Table B’s side. This keeps the score on a consistent scale regardless of whether a discrepancy comes from a value change, a missing row, or a missing column.
Example
Table A has 100 rows × 10 columns (1,000 cells). Table B is identical in shape and content except for 4 differing values.- Total cells: 1,000 + 1,000 = 2,000
- Non-matching cells: 4 × 2 = 8
- Match Score: (2,000 − 8) / 2,000 = 99.6%
Why an extra column lowers the score
Every contribution penalizes the score — not just value differences. A table with identical values but one extra column will not score 100%, because that column’s cells exist on only one side. For example, if Table A has the extra column (100 rows × 1 column = 100 cells), those 100 cells are added to the non-matching count, dropping the score to (2,000 − 100) / 2,000 = 95%.Edge cases
- Empty tables: if neither table has any cells, the Match Score is 0%, not 100%. There is nothing to match.
- Sampling: when sampling is enabled, the Match Score is computed using the sampled row counts, not the full table sizes. The score reflects the sample.
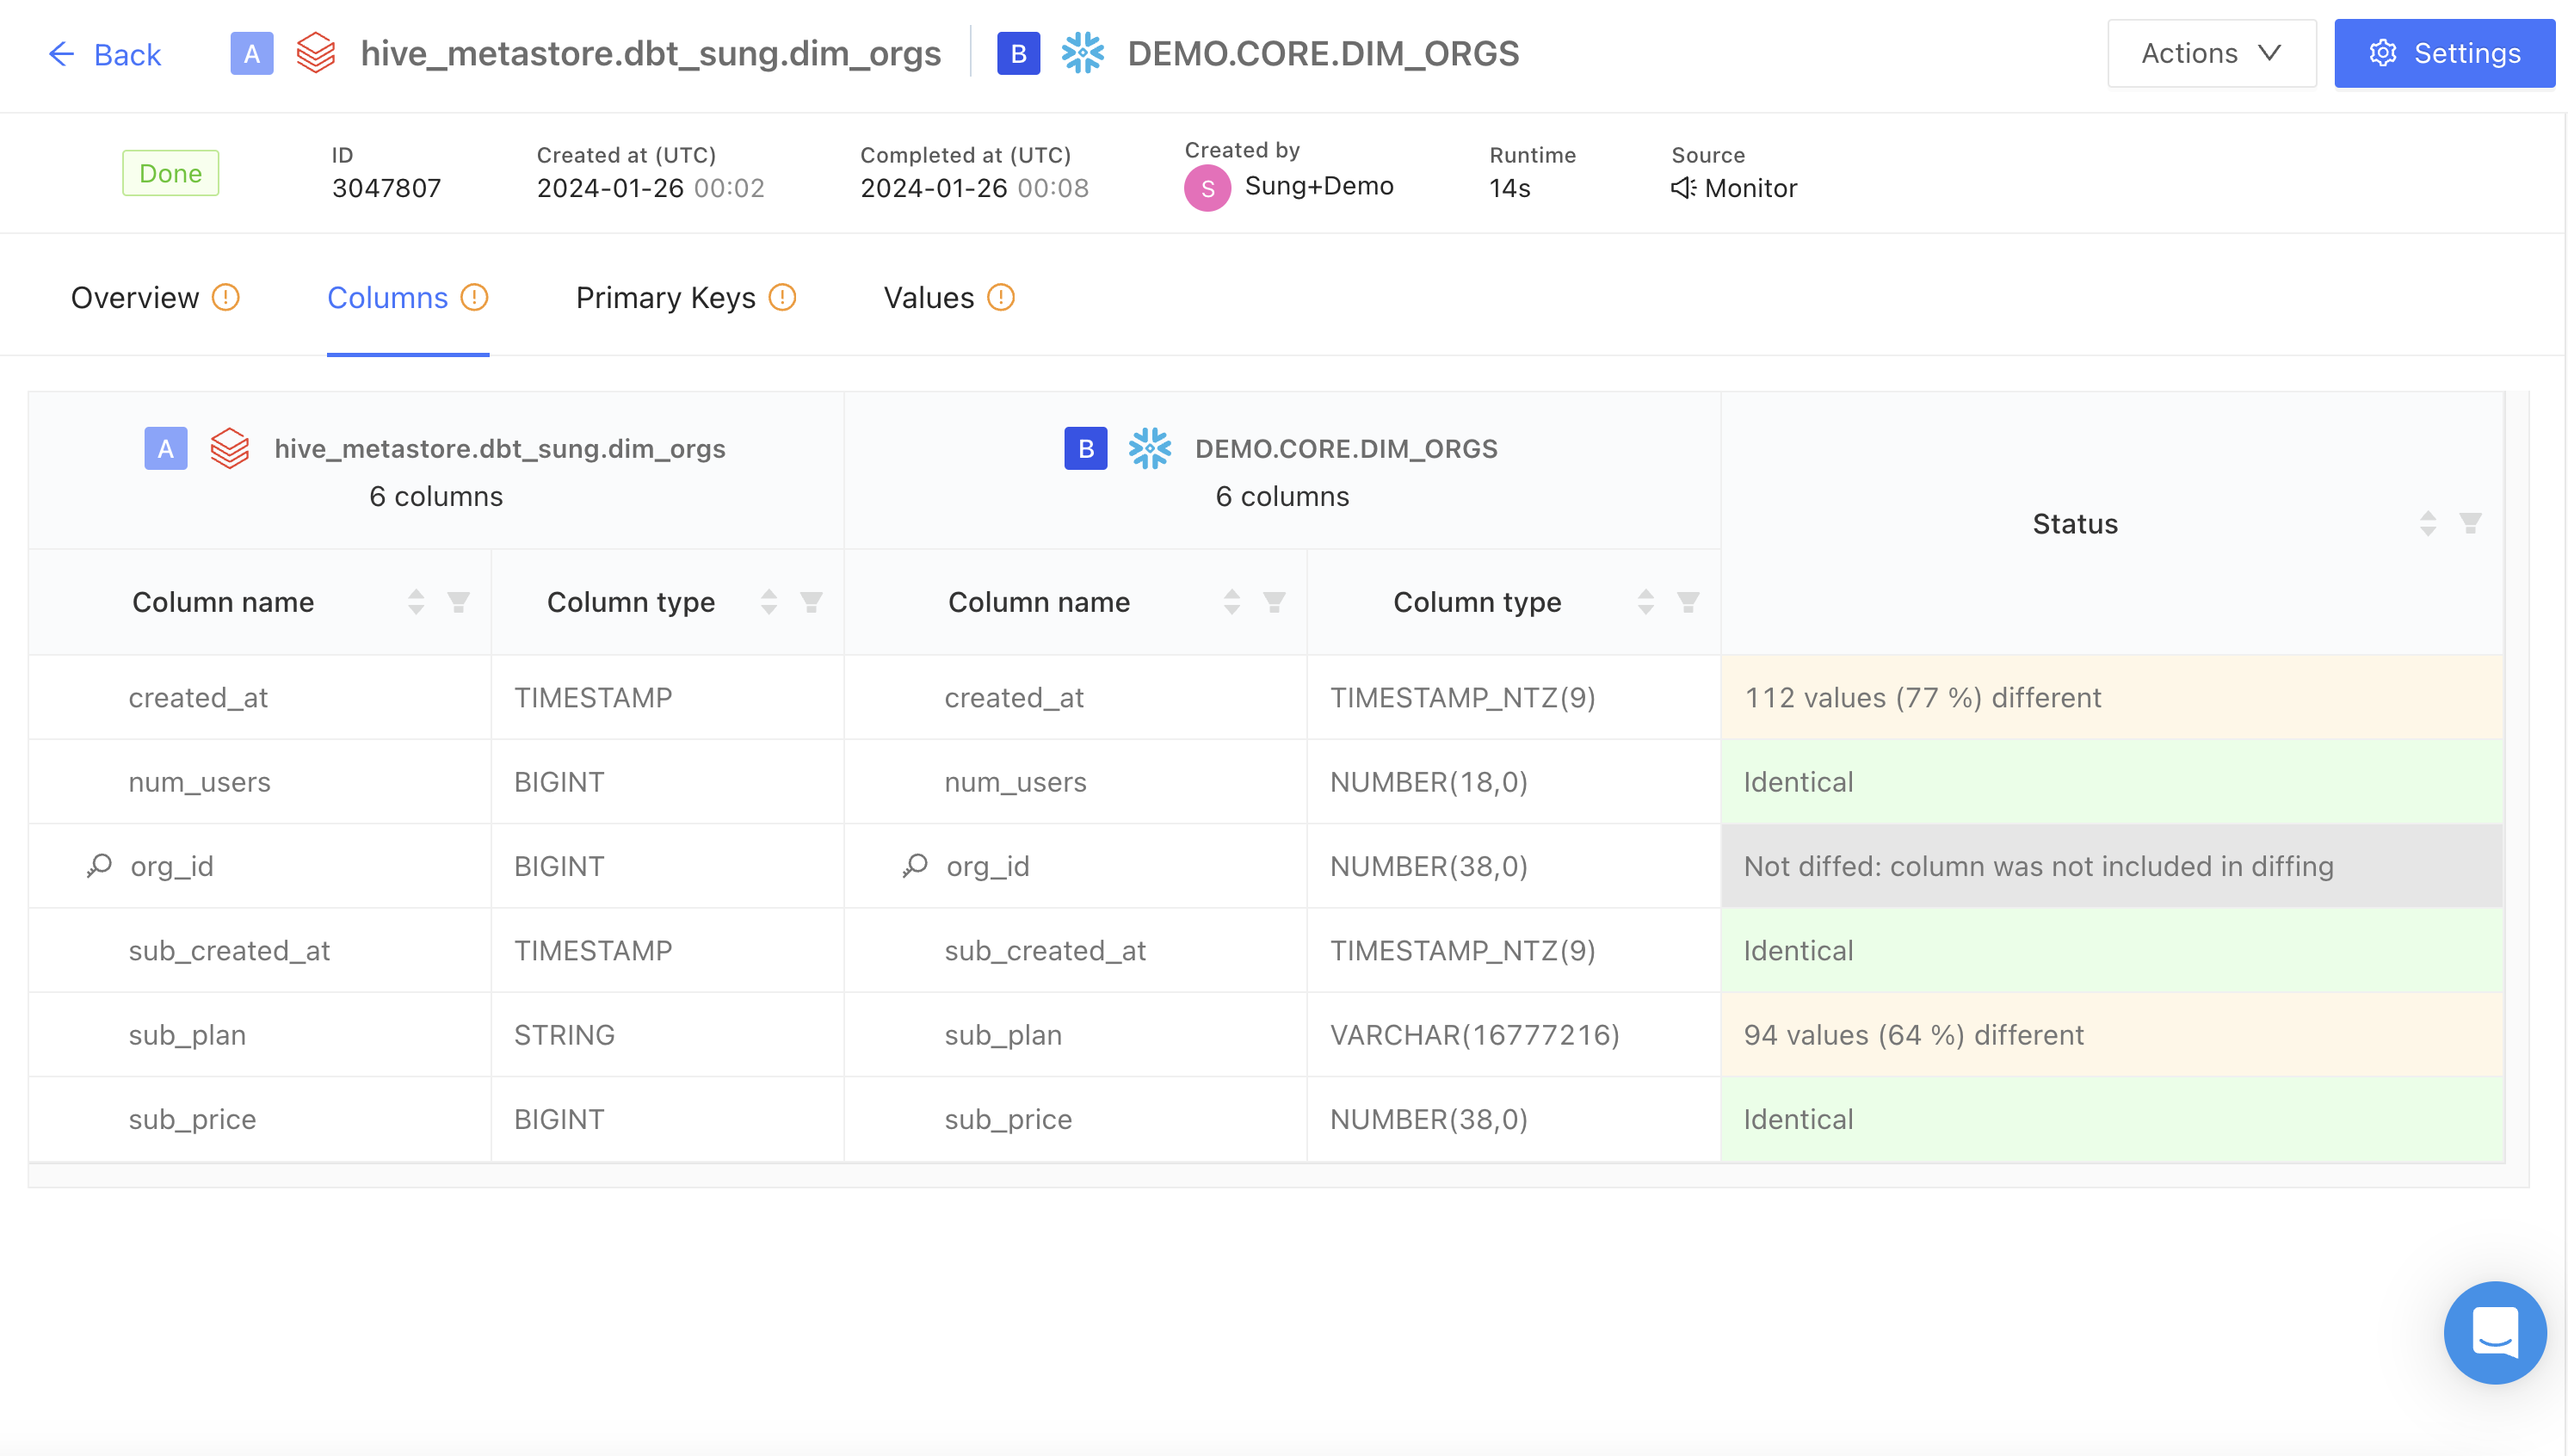
Columns
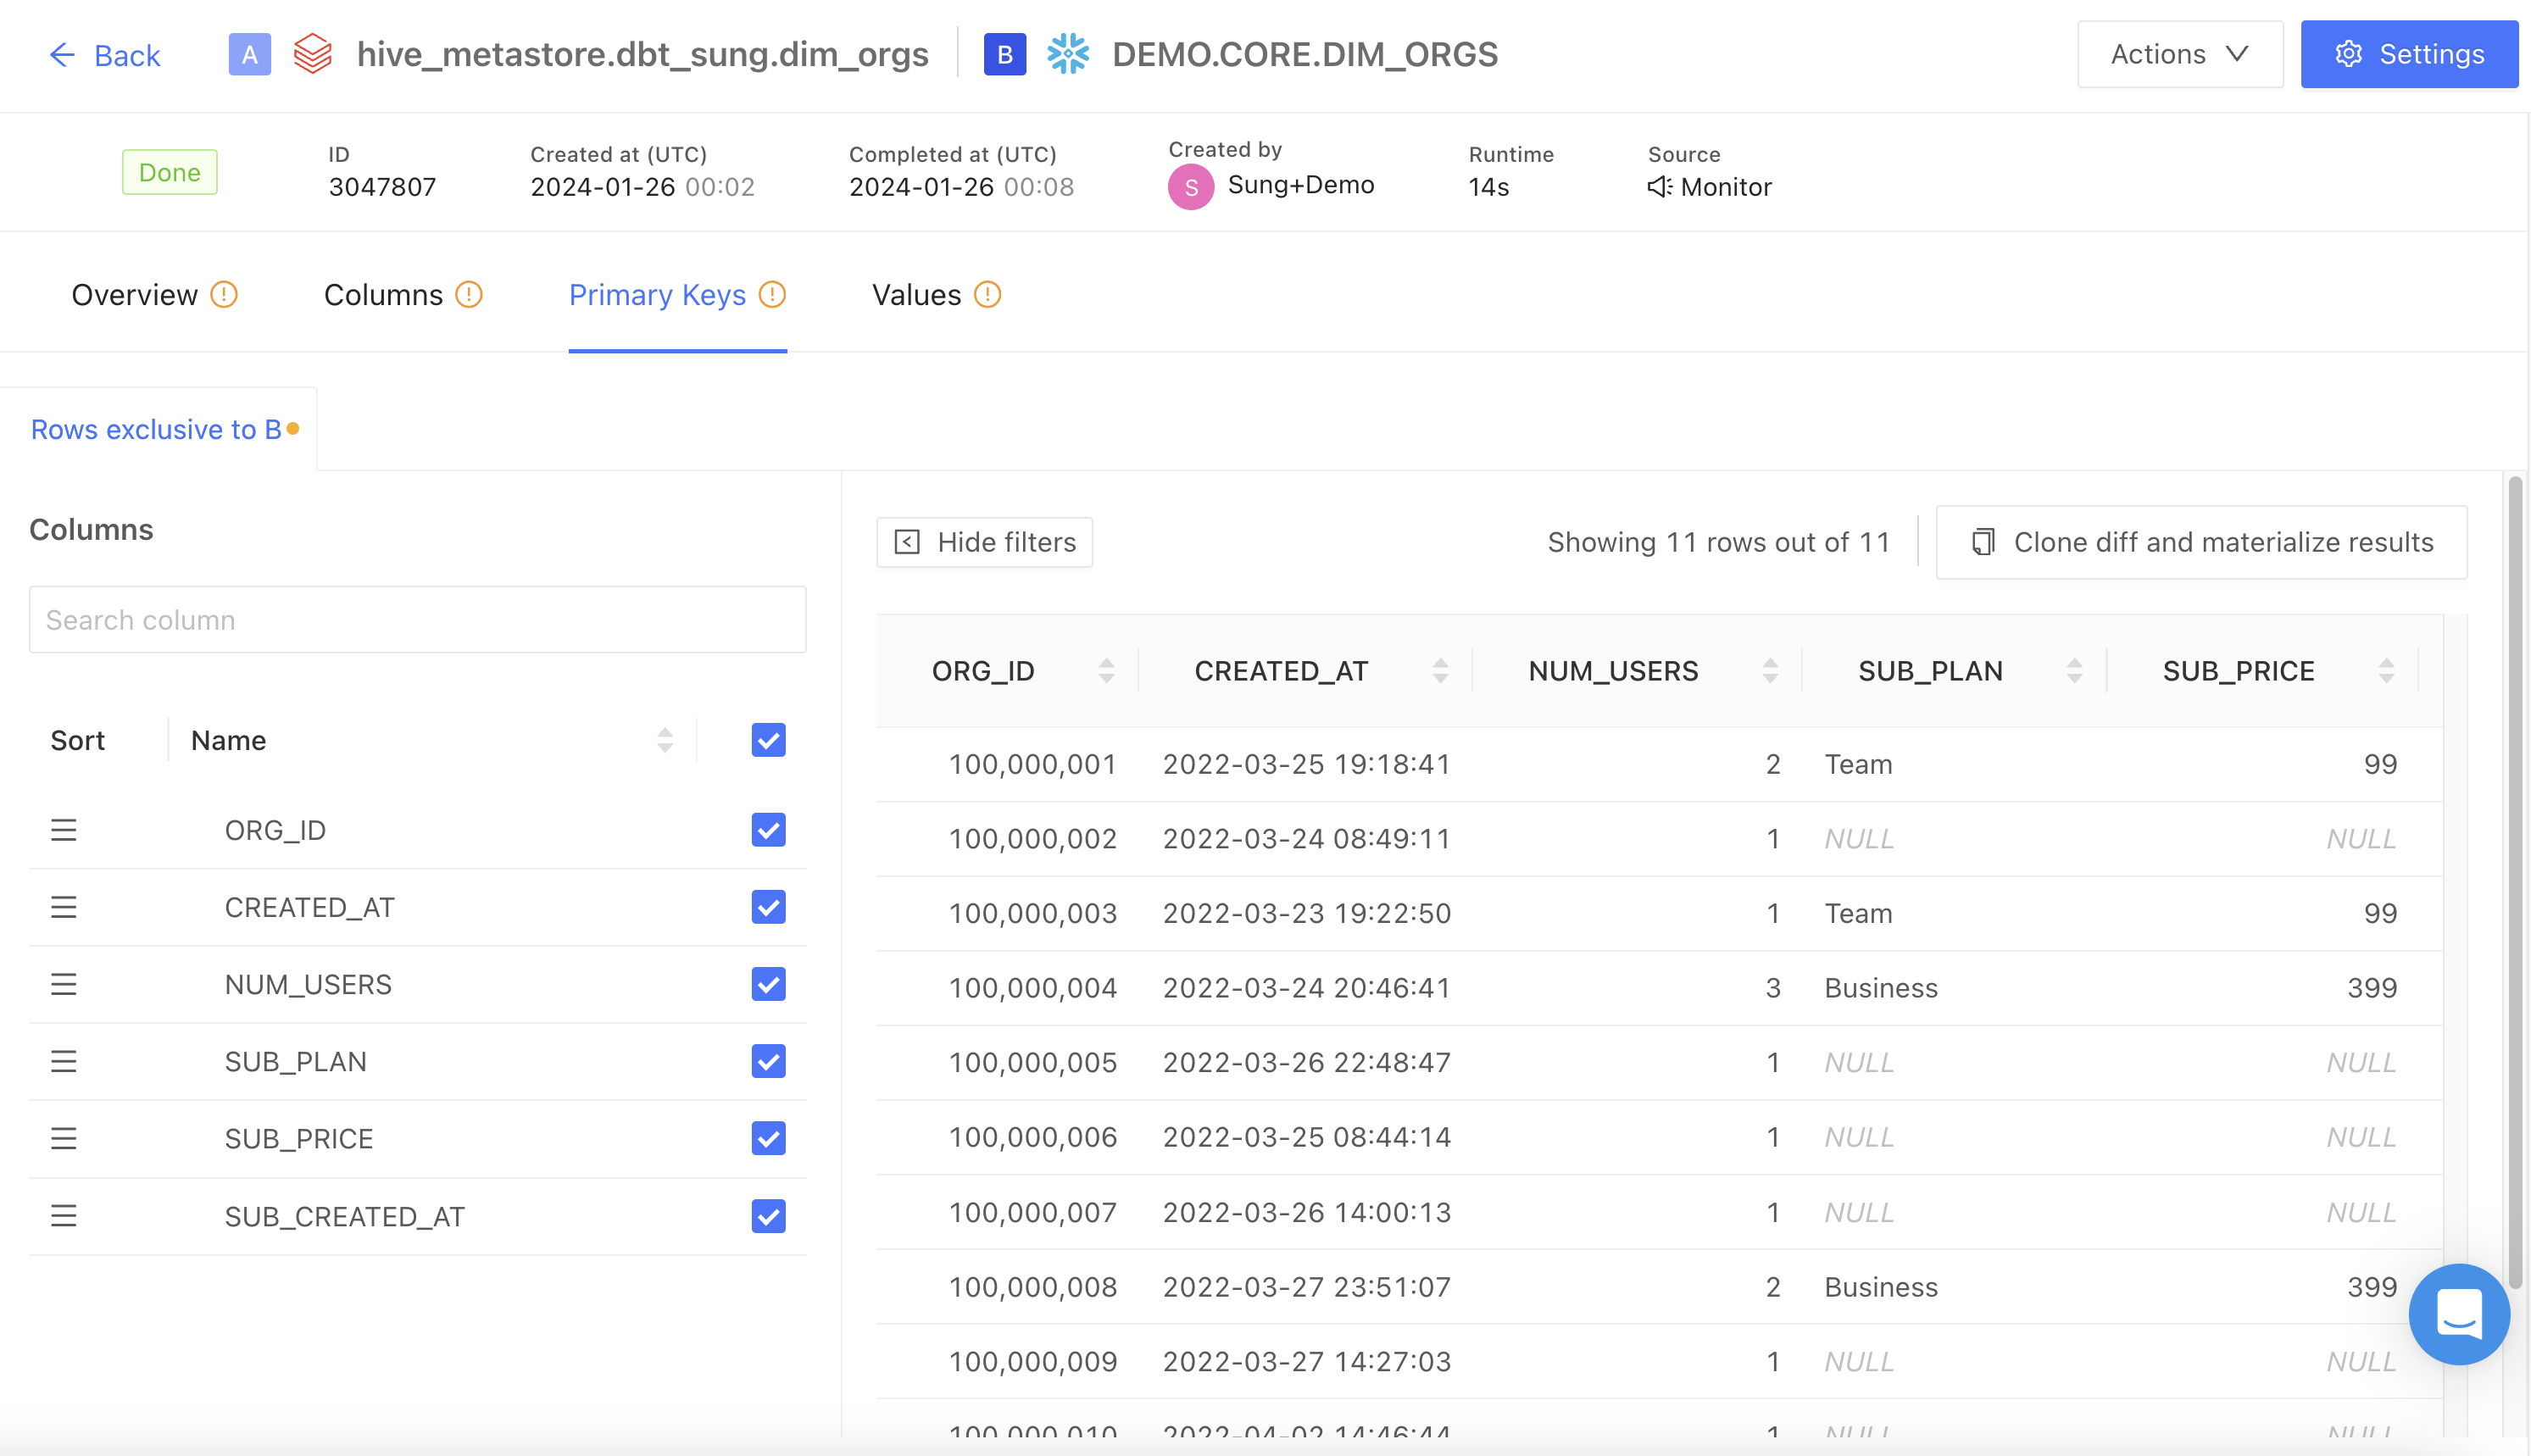
Primary keys
Values
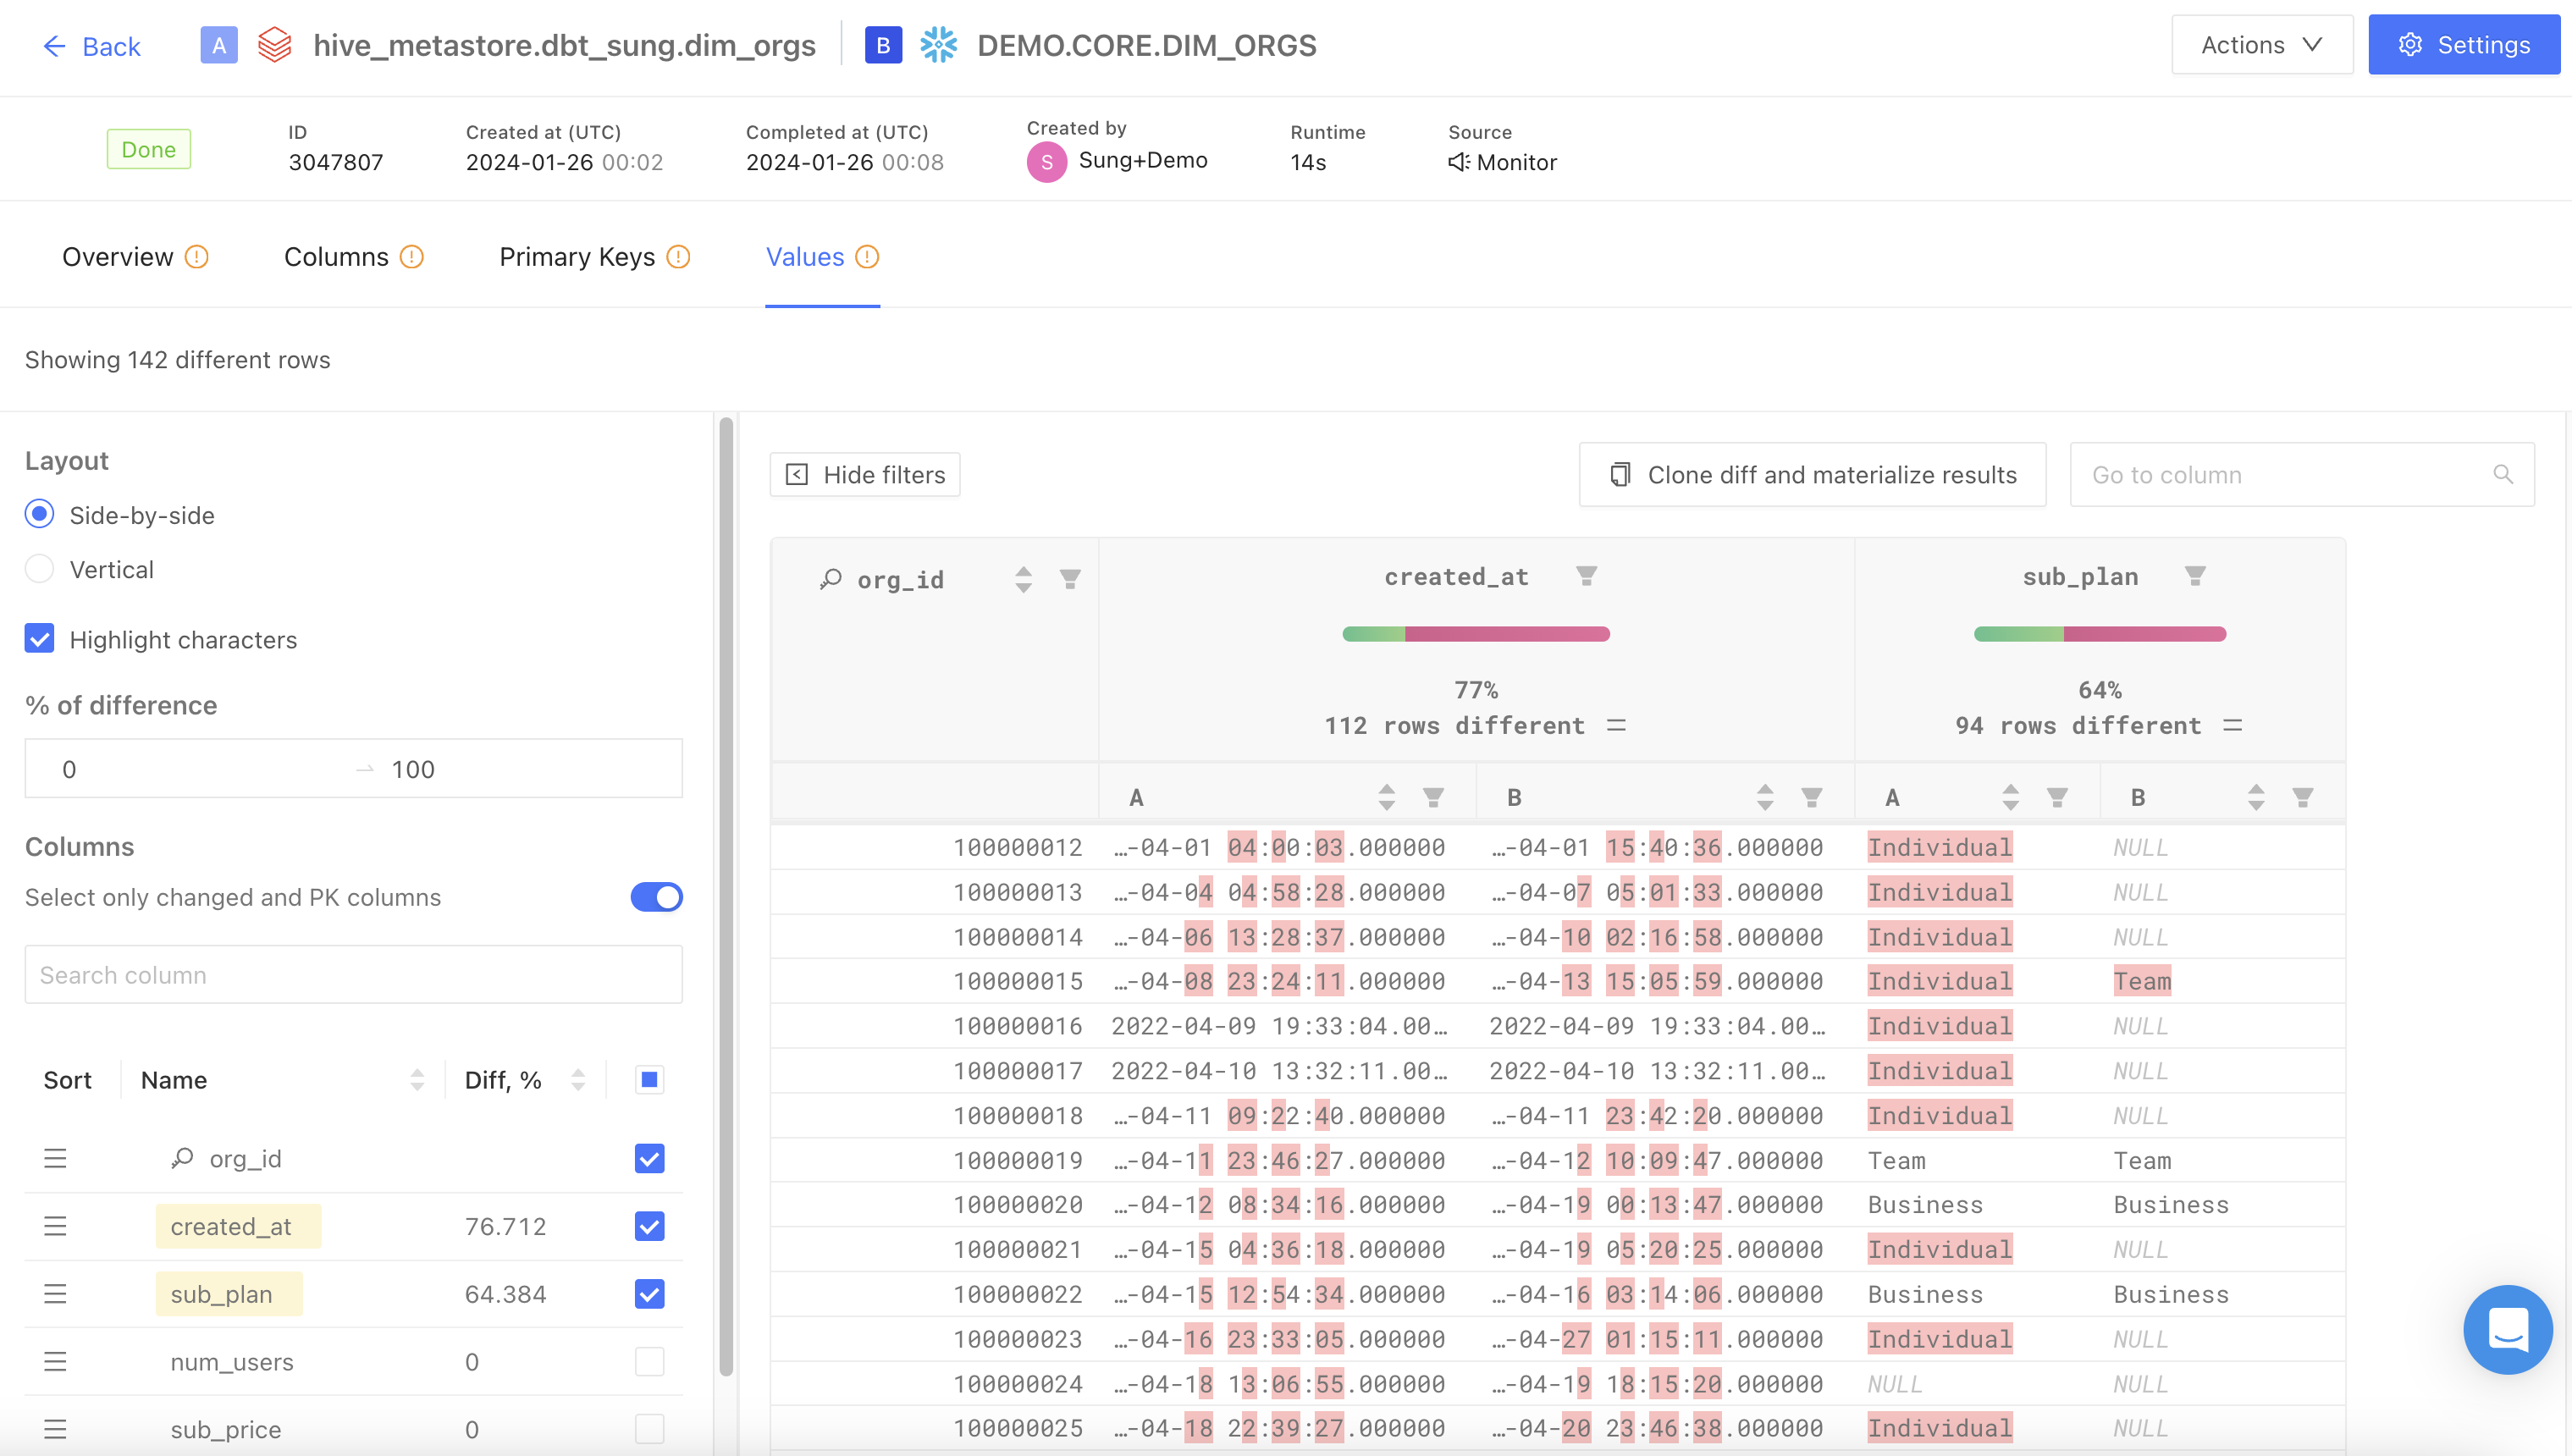
- Highlight characters: highlight value differences between tables
- % of difference: filters and displays columns based on the specified percentage range of value differences