> ## Documentation Index
> Fetch the complete documentation index at: https://docs.datafold.com/llms.txt
> Use this file to discover all available pages before exploring further.
# Metric Monitors
> Metric monitors detect anomalies in your data using ML-based algorithms or manual thresholds, supporting standard and custom metrics for tables or columns.
**INFO**
Please contact [support@datafold.com](mailto:support@datafold.com) if you'd like to enable this feature for your organization.
Metric monitors allow you to perform anomaly detection—either automatically using our ML-based algorithm or by setting manual thresholds—on the following metric types:
1. Standard metrics (e.g. row count, freshness, and cardinality)
2. Custom metrics (e.g. sales volume per region)
## Create a Metric monitor
There are two ways to create a Metric Monitor:
1. Open the **Monitors** page, select **Create new monitor**, and then choose **Metric**.
2. Clone an existing Metric monitor by clicking **Actions** and then **Clone**. This will pre-fill the form with the existing monitor configuration.
## Set up your monitor
Select your data connection, then choose the type of metric you'd like: **Table**, **Column**, or **Custom**.
If you select table or column, you have the option to add a SQL filter to refine your dataset. For example, you could implement a 7-day rolling time window with the following: `timestamp >= dateadd(day, -7, current_timestamp)`. Please ensure the SQL is compatible with your selected data connection.
## Metric types
### Table metrics
| Metric | Definition | Additional Notes |
| --------- | --------------------------------- | -------------------------------------------------------------------------------------------------------------- |
| Freshness | Time since table was last updated | Measured in minutes. Derived from INFORMATION\_SCHEMA. Only supported for Snowflake, BigQuery, and Databricks. |
| Row Count | Total number of rows | |
### Column metrics
| Metric | Definition | Supported Column Types | Additional Notes |
| ------------------ | ------------------------------ | ---------------------- | -------------------------- |
| Cardinality | Number of distinct values | All types | |
| Uniqueness | Proportion of distinct values | All types | Proportion between 0 and 1 |
| Minimum | Lowest numeric value | Numeric columns | |
| Maximum | Highest numeric value | Numeric columns | |
| Average | Mean value | Numeric columns | |
| Median | Median value (50th percentile) | Numeric columns | |
| Sum | Sum of all values | Numeric columns | |
| Standard Deviation | Measure of data spread | Numeric columns | |
| Fill Rate | Proportion of non-null values | All types | Proportion between 0 and 1 |
### Custom metrics
Our custom metric framework is extremely flexible and supports several approaches to defining metrics. Depending on the approach you choose, your query should return some combination of the following columns:
* **Metric value (required)**: a numeric column containing your *metric values*
* **Timestamp (optional)**: a date/time column containing *timestamps* corresponding to your metric values
* **Group (optional)**: a string column containing *groups/dimensions* for your metric
**INFO**
The names and order of your columns don't matter. Datafold will automatically infer their meaning based on data type.
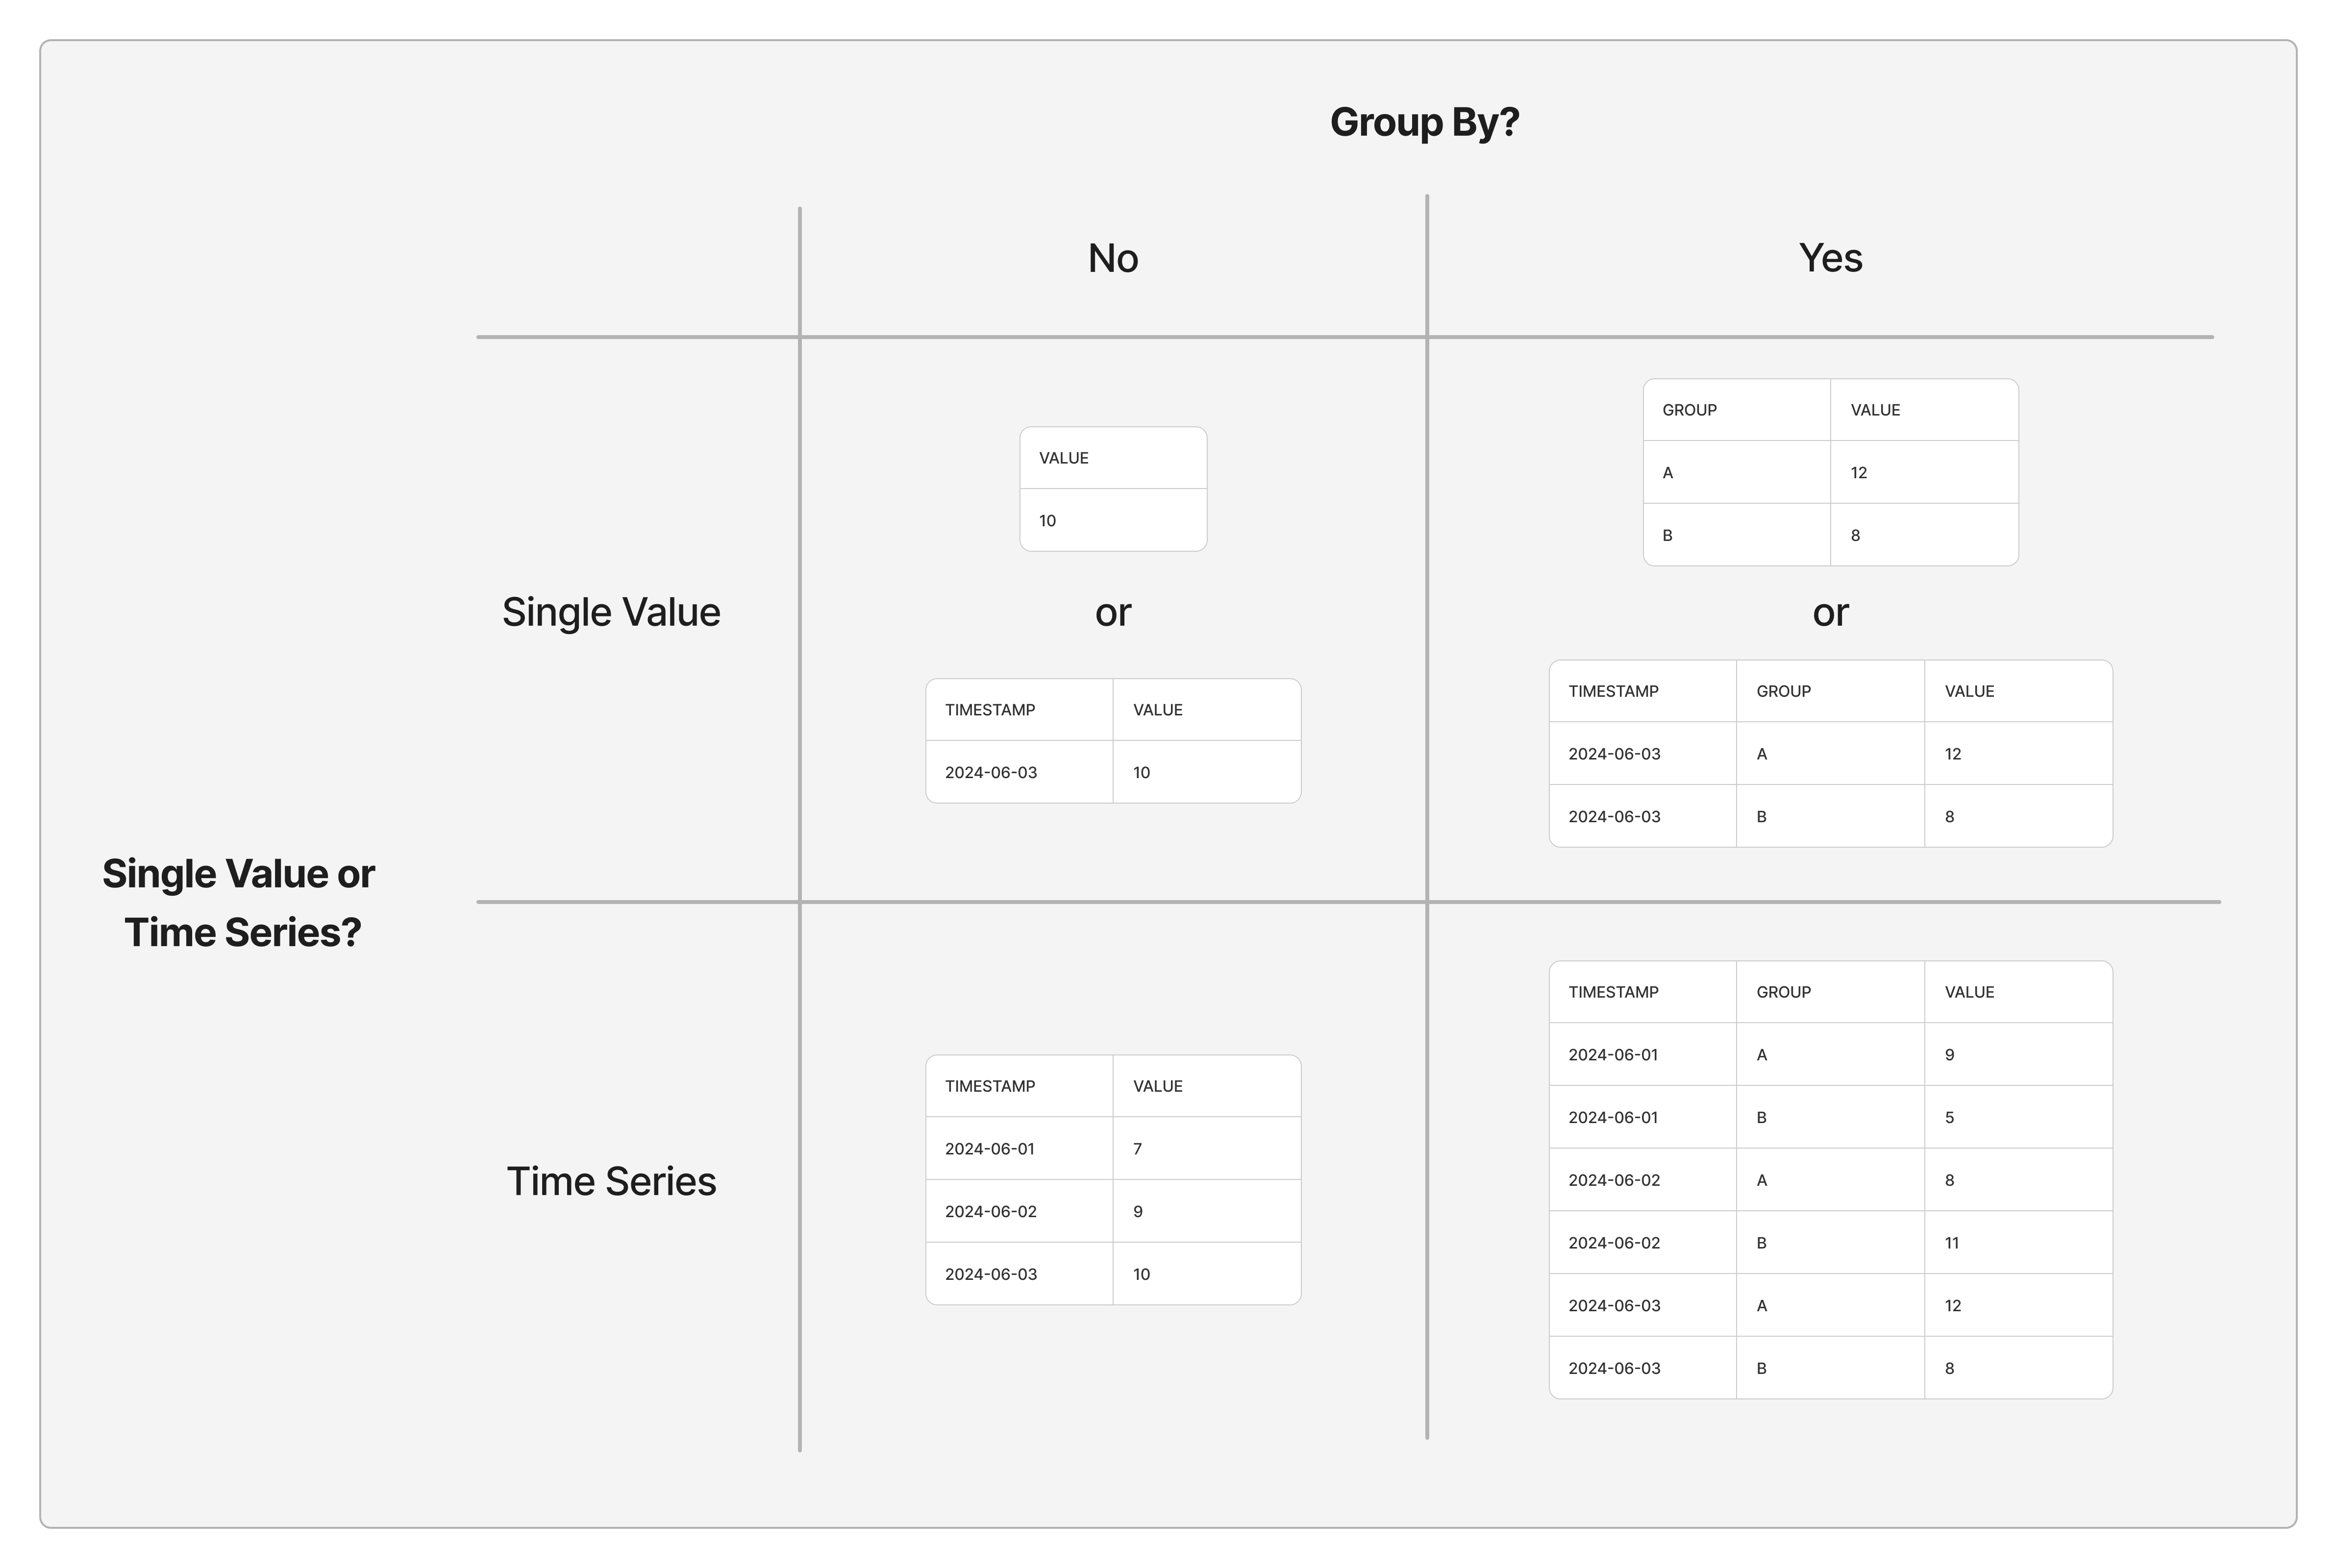 The following questions will help you decide which approach is best for you:
1. **Do you want to group your metric by the value of a column in your query?** For example, if your metric is *sales volume per day*, rather than looking at a single metric that encompasses all sales globally, it might be more informative to group by country. In this case, Datafold will automatically compute sales volume separately for each country to assist with root cause analysis when there’s an unexpected change.
2. **Will your query return a single metric value (per group, if relevant) on every monitor run, or an entire time series?** We generally recommend starting with the simpler approach of providing a single metric value (per group) per monitor run. However, if you’ve already defined a time series elsewhere (e.g. in your BI tool) and simply want to copy/paste that query into Datafold, then you may prefer the latter approach.
**INFO**
Datafold will only log a single data point per timestamp per group, which means you should only send data for a particular time period once that period is complete.
1. **If your metric returns a single value per monitor run, will you provide your own timestamps or use the timestamps of monitor runs?** If your query returns a single value per run, we generally recommend letting Datafold provide timestamps based on monitor runs unless you have a compelling reason to provide your own. For example, if your metric always lags by one day, you could explicitly associate yesterday's date with each observation.
As you're writing your query, Datafold will let you know if the result set doesn't match one of the accepted patterns. If you have questions, please contact us and we'll be happy to help.
## Configure anomaly detection
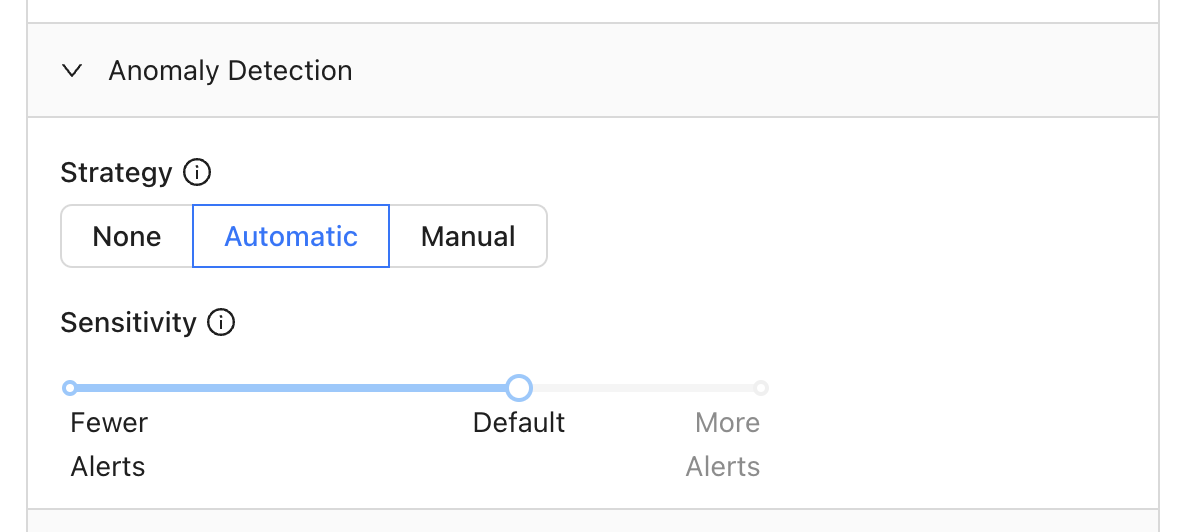
Enable anomaly detection to get the most out of metric monitors. You have several options:
* **Automatic**: our automated anomaly detection uses machine learning to flag metric values that are out of the ordinary. Dial the sensitivity up or down depending on how many alerts you'd like to receive.
* **Manual**: specific thresholds beyond which you'd like the monitor to trigger an alert. **Fixed Values** are specific minimum and/or maximum values, while **Percent Change** measure the magnitude of change from one observation to the next.
The following questions will help you decide which approach is best for you:
1. **Do you want to group your metric by the value of a column in your query?** For example, if your metric is *sales volume per day*, rather than looking at a single metric that encompasses all sales globally, it might be more informative to group by country. In this case, Datafold will automatically compute sales volume separately for each country to assist with root cause analysis when there’s an unexpected change.
2. **Will your query return a single metric value (per group, if relevant) on every monitor run, or an entire time series?** We generally recommend starting with the simpler approach of providing a single metric value (per group) per monitor run. However, if you’ve already defined a time series elsewhere (e.g. in your BI tool) and simply want to copy/paste that query into Datafold, then you may prefer the latter approach.
**INFO**
Datafold will only log a single data point per timestamp per group, which means you should only send data for a particular time period once that period is complete.
1. **If your metric returns a single value per monitor run, will you provide your own timestamps or use the timestamps of monitor runs?** If your query returns a single value per run, we generally recommend letting Datafold provide timestamps based on monitor runs unless you have a compelling reason to provide your own. For example, if your metric always lags by one day, you could explicitly associate yesterday's date with each observation.
As you're writing your query, Datafold will let you know if the result set doesn't match one of the accepted patterns. If you have questions, please contact us and we'll be happy to help.
## Configure anomaly detection
Enable anomaly detection to get the most out of metric monitors. You have several options:
* **Automatic**: our automated anomaly detection uses machine learning to flag metric values that are out of the ordinary. Dial the sensitivity up or down depending on how many alerts you'd like to receive.
* **Manual**: specific thresholds beyond which you'd like the monitor to trigger an alert. **Fixed Values** are specific minimum and/or maximum values, while **Percent Change** measure the magnitude of change from one observation to the next.
 ## Add a schedule
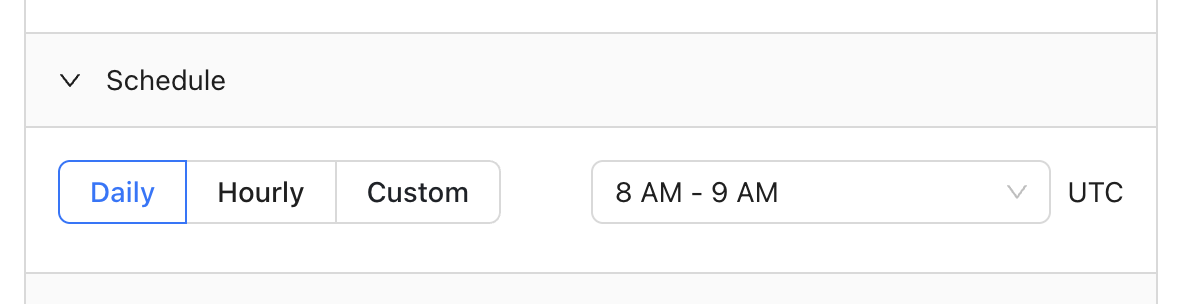
You can choose to run your monitor daily, hourly, or even input a cron expression for more complex scheduling:
## Add a schedule
You can choose to run your monitor daily, hourly, or even input a cron expression for more complex scheduling:
 ## Add notifications
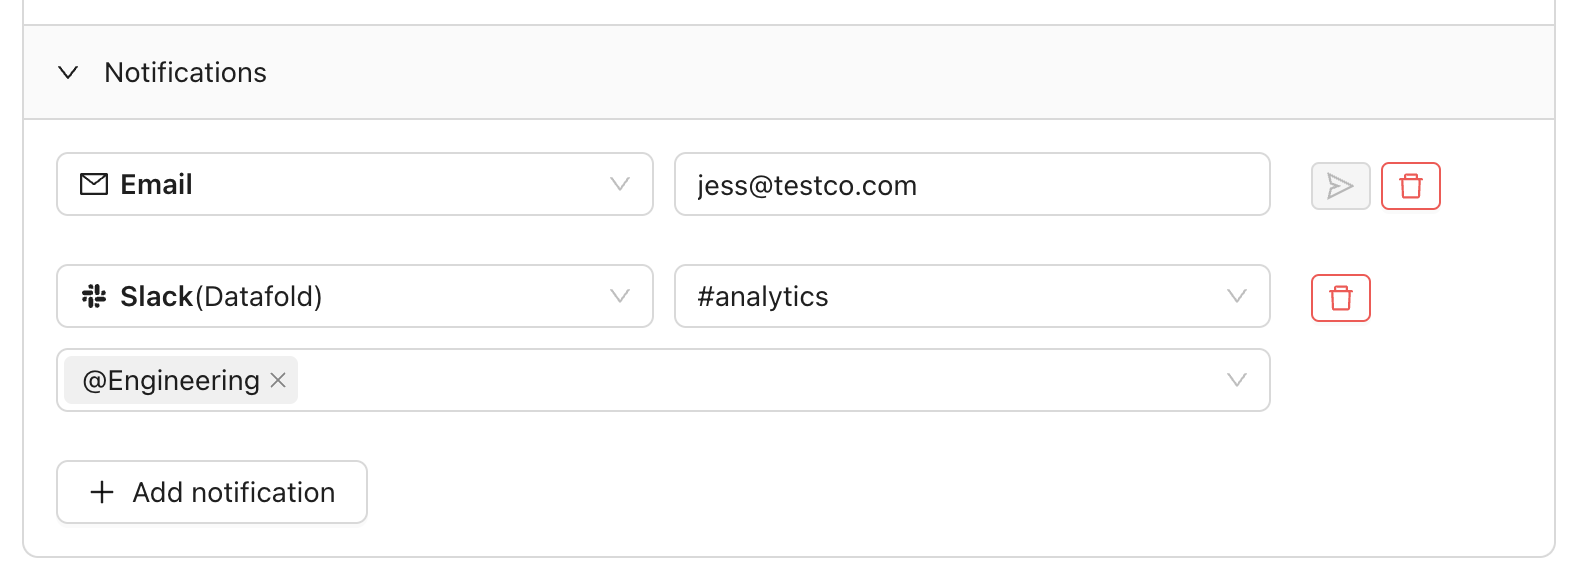
Send notifications via Slack or email when your monitor exceeds a threshold (automatic or manual):
## Add notifications
Send notifications via Slack or email when your monitor exceeds a threshold (automatic or manual):
 ## Need help?
If you have any questions about how to use Metric monitors, please reach out to our team via Slack, in-app chat, or email us at [support@datafold.com](mailto:support@datafold.com).
## Need help?
If you have any questions about how to use Metric monitors, please reach out to our team via Slack, in-app chat, or email us at [support@datafold.com](mailto:support@datafold.com).