> ## Documentation Index
> Fetch the complete documentation index at: https://docs.datafold.com/llms.txt
> Use this file to discover all available pages before exploring further.
# Data Diff Monitors
> Data Diff monitors compare datasets across or within databases, identifying row and column discrepancies with customizable scheduling and notifications.
## Ways to create a data diff monitor
There are 3 ways to create a data diff monitor:
1. From the **Monitors** page by clicking **Create new monitor** and then selecting **Data diff** as a type of monitor.
2. Clone an existing monitor by clicking **Actions** and then **Clone** in the header menu. This will pre-fill the form with the existing monitor configuration.
3. Create a monitor directly from the data diff results by clicking **Actions** and **Create monitor**. This will pre-fill the configuration with the parent data diff settings, requiring updates only for the **Schedule** and **Notifications** sections.
Once a monitor is created and initial metrics collected, you can set up [thresholds](/data-monitoring/monitors/data-diff-monitors#monitoring) for the two metrics.
## Create a new data diff monitor
Setting up a new diff monitor in Datafold is straightforward. You can configure it with the following parameters and options:
### General
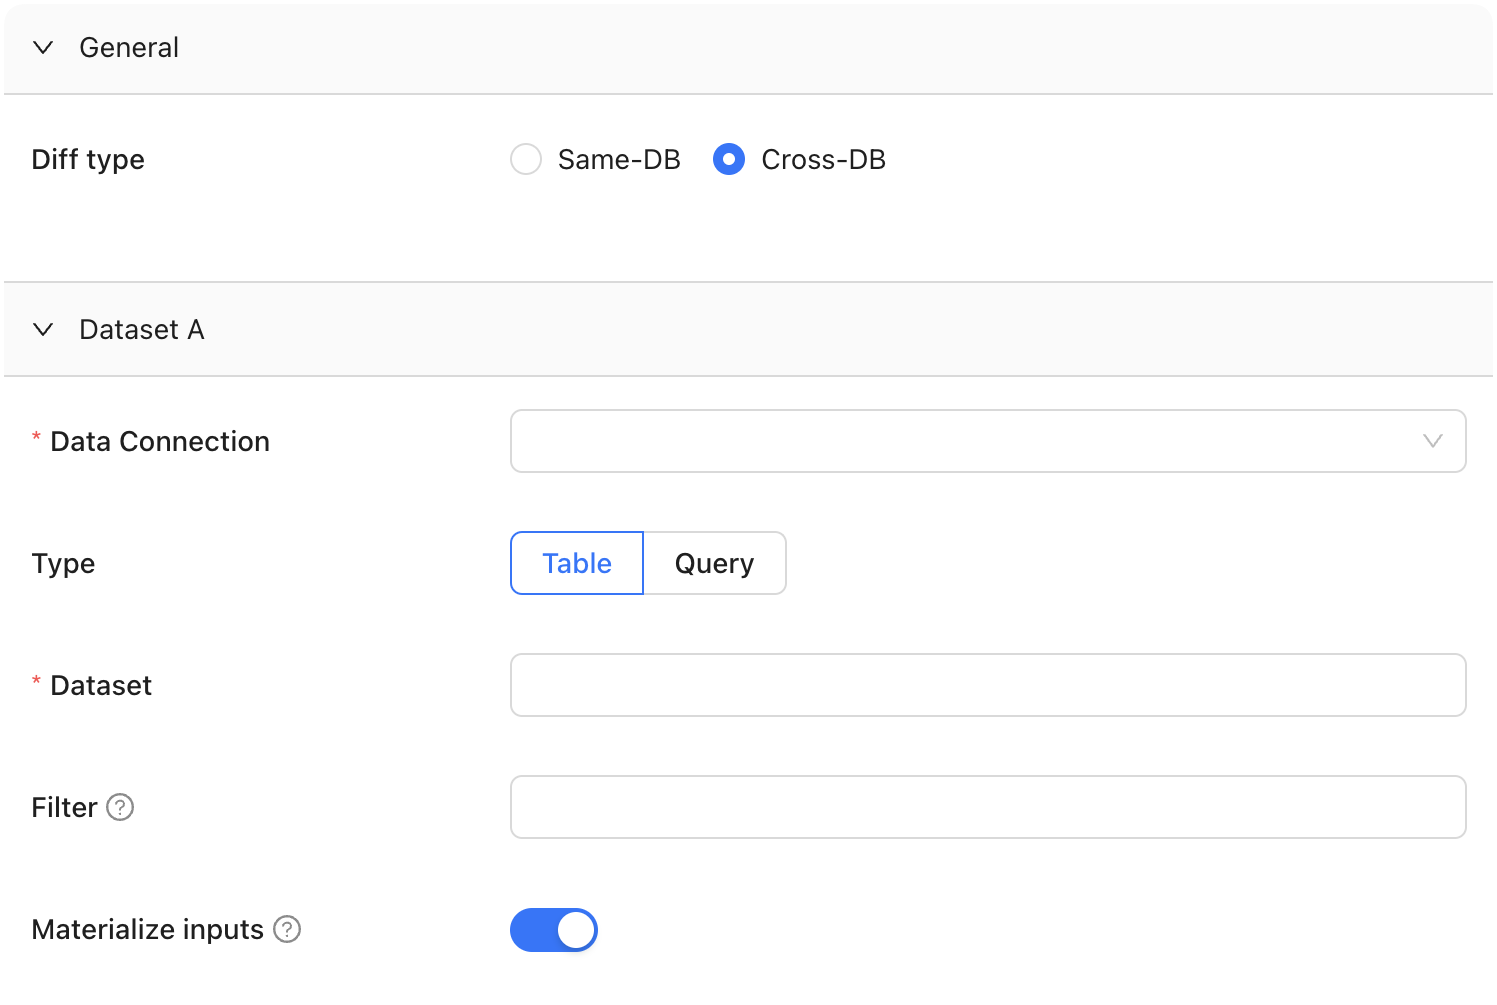
Choose how you want to compare your data and whether the diff type is in-database or cross-database.
Pick your data connections. Then, choose the two datasets you want to compare. This can be a table or a view in your relational database.
If you need to compare just a subset of data (e.g., for a particular city or last two weeks), add a SQL filter.
Select **Materialize inputs** to improve diffing speed when query is heavy on compute, or if filters are applied to non-indexed columns, or if primary keys are transformed using concatenation, coalesce, or another function.
 ### Column remapping
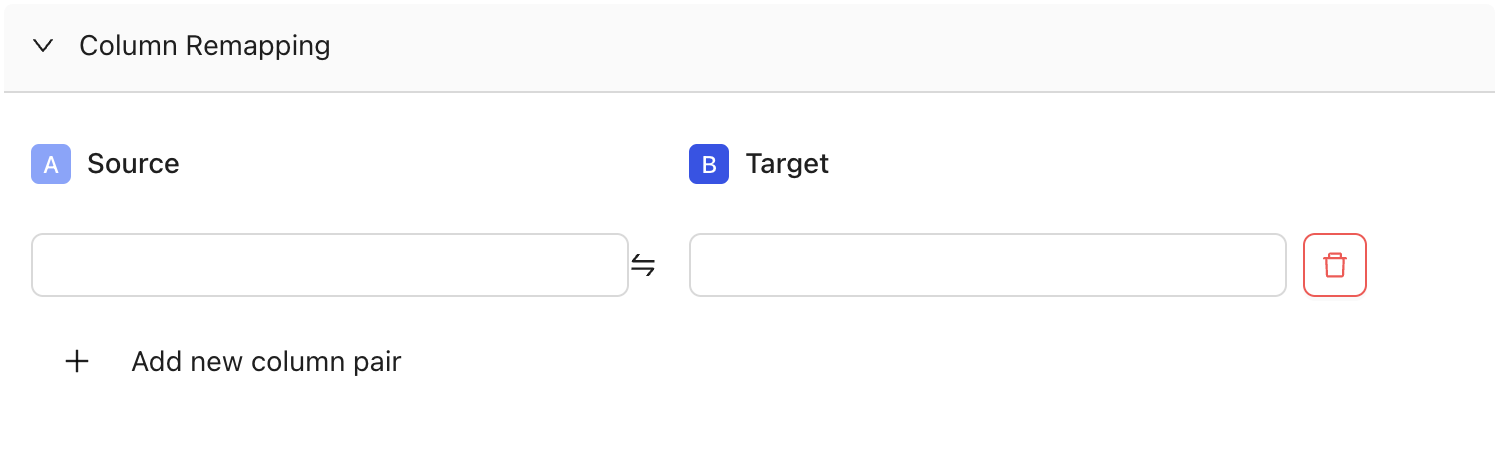
When columns are the same data type but are named differently, column remapping allows you to align and compare them. This is useful when datasets have semantically identical columns with different names, such as `userID` and `user_id`. Datafold will surface any differences under the column name used in Dataset A.
### Column remapping
When columns are the same data type but are named differently, column remapping allows you to align and compare them. This is useful when datasets have semantically identical columns with different names, such as `userID` and `user_id`. Datafold will surface any differences under the column name used in Dataset A.
 ### Diff settings
 #### Primary key
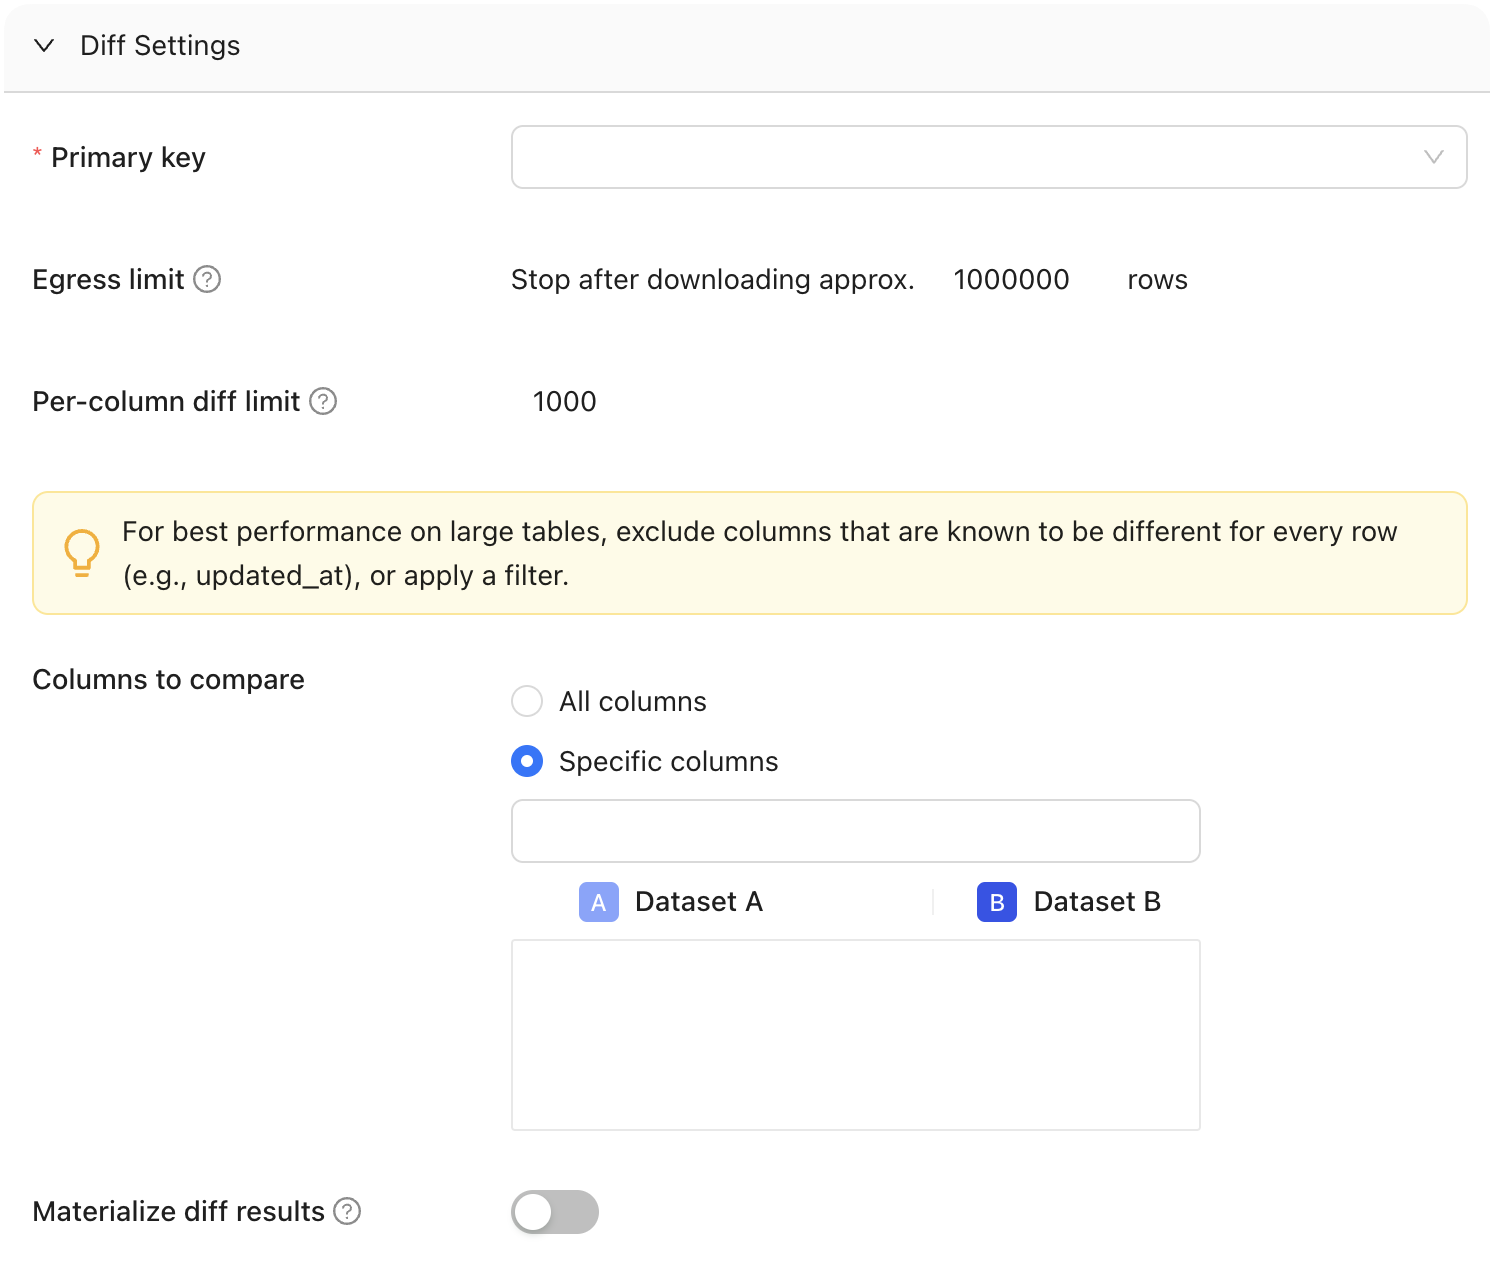
The primary key is one or more columns used to uniquely identify a row in the dataset during diffing. The primary key (or keys) does not need to be formally defined in the database or elsewhere as it is used for unique row identification during diffing. Multiple columns support compound primary key definitions.
#### Columns to compare
Determine whether to compare all columns or select specific one(s). To optimize performance on large tables, it's recommended to exclude columns known to have unique values for every row, such as timestamp columns like "updated\_at," or apply filters to limit the comparison scope.
#### Materialize diff results
Choose whether to store diff results in a table.
#### Sampling
Use this to compare a subset of your data instead of the entire dataset. This is best for assessing large datasets.
There are two ways to enable sampling in Monitors: [Tolerance](#tolerance) and [% of Rows](#-of-rows).
**TIP**
When should I use sampling tolerance instead of percent of rows?
Each has its specific use cases and benefits, please [see the FAQ section](#sampling-tolerance-vs--of-rows) for a more detailed breakdown.
##### Tolerance
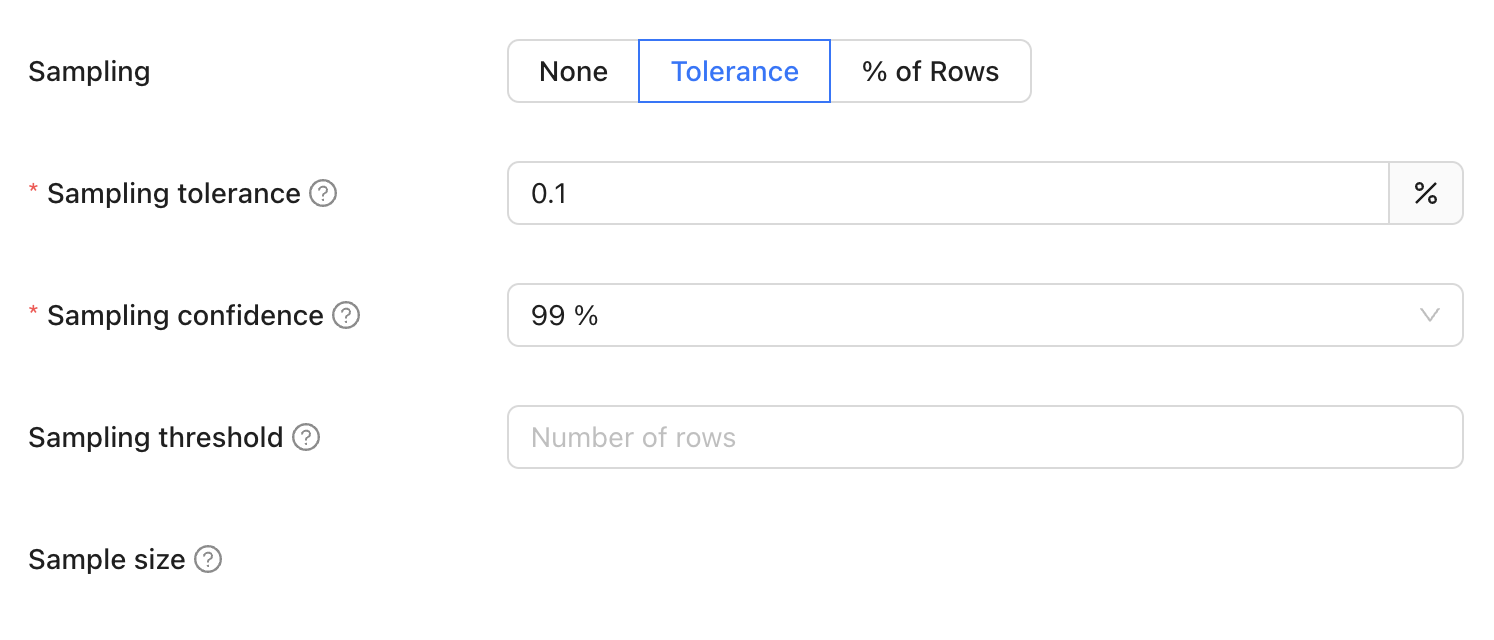
Tolerance defines the allowable margin of error for our estimate. It sets the acceptable percentage of rows with primary key errors (like nulls, duplicates, or primary keys exclusive to one dataset) before disabling sampling.
#### Primary key
The primary key is one or more columns used to uniquely identify a row in the dataset during diffing. The primary key (or keys) does not need to be formally defined in the database or elsewhere as it is used for unique row identification during diffing. Multiple columns support compound primary key definitions.
#### Columns to compare
Determine whether to compare all columns or select specific one(s). To optimize performance on large tables, it's recommended to exclude columns known to have unique values for every row, such as timestamp columns like "updated\_at," or apply filters to limit the comparison scope.
#### Materialize diff results
Choose whether to store diff results in a table.
#### Sampling
Use this to compare a subset of your data instead of the entire dataset. This is best for assessing large datasets.
There are two ways to enable sampling in Monitors: [Tolerance](#tolerance) and [% of Rows](#-of-rows).
**TIP**
When should I use sampling tolerance instead of percent of rows?
Each has its specific use cases and benefits, please [see the FAQ section](#sampling-tolerance-vs--of-rows) for a more detailed breakdown.
##### Tolerance
Tolerance defines the allowable margin of error for our estimate. It sets the acceptable percentage of rows with primary key errors (like nulls, duplicates, or primary keys exclusive to one dataset) before disabling sampling.
 When sampling tolerance is enabled, not every row is examined, which introduces a probability of missing certain discrepancies. This threshold represents the level of difference we are willing to accept before considering the results unreliable and thereby disabling sampling. It essentially sets a limit on how much variance is tolerable in the sample compared to the complete dataset.
Default: 0.001%
###### Sampling confidence
Sampling confidence reflects our level of certainty that our sample accurately represents the entire dataset. It represents the minimum confidence level that the rate of primary key errors is below the threshold defined in sampling tolerance.
To put it simply, a 95% confidence level with a 5% tolerance means we are 95% certain that the true value falls within 5% of our estimate.
Default: 99%
###### Sampling threshold
Sampling will be disabled if total row count of the largest table is less that the threshold value.
###### Sample size
This provides an estimated count of the total number of rows included in the combined sample from Datasets A and B, used for the diffing process. It's important to note that this number is an estimate and can vary from the actual sample size due to several factors:
* The presence of duplicate primary keys in the datasets will likely increase this estimate, as it inflates the perceived uniqueness of rows
* Applying filters to the datasets tends to reduce the estimate, as it narrows down the data scope
The number of rows we sample is not fixed; instead, we use a statistical approach called the Poisson distribution. This involves picking rows randomly from an infinite pool of rows with uniform random sampling. Importantly, we don't need to perform a full diff (compare every single row) to establish a baseline.
Example: Imagine there are two datasets we want to compare, Main and Test. Since we prefer not to check every row, we use a statistical approach to determine the number of rows to sample from each dataset. To do so, we set the following parameters:
* Sampling tolerance: 5%
* Sampling confidence: 95%
Sampling confidence reflects our level of certainty that our sample accurately represents the entire dataset, while sampling tolerance defines the allowable margin of error for our estimate. Here, with a 95% sampling confidence and a 5% sampling tolerance, we are 95% confident that the true value falls within 5% of our estimate. Datafold will then estimate the sample size needed (e.g., 200 rows) to achieve these parameters.
##### % of rows
Percent of rows sampling defines the proportion of the dataset to be included in the sample by specifying a percentage of the total number of rows. For example, setting the sampling percentage to 0.1% means that only 0.1% of the total rows will be sampled for analysis or comparison.
When sampling tolerance is enabled, not every row is examined, which introduces a probability of missing certain discrepancies. This threshold represents the level of difference we are willing to accept before considering the results unreliable and thereby disabling sampling. It essentially sets a limit on how much variance is tolerable in the sample compared to the complete dataset.
Default: 0.001%
###### Sampling confidence
Sampling confidence reflects our level of certainty that our sample accurately represents the entire dataset. It represents the minimum confidence level that the rate of primary key errors is below the threshold defined in sampling tolerance.
To put it simply, a 95% confidence level with a 5% tolerance means we are 95% certain that the true value falls within 5% of our estimate.
Default: 99%
###### Sampling threshold
Sampling will be disabled if total row count of the largest table is less that the threshold value.
###### Sample size
This provides an estimated count of the total number of rows included in the combined sample from Datasets A and B, used for the diffing process. It's important to note that this number is an estimate and can vary from the actual sample size due to several factors:
* The presence of duplicate primary keys in the datasets will likely increase this estimate, as it inflates the perceived uniqueness of rows
* Applying filters to the datasets tends to reduce the estimate, as it narrows down the data scope
The number of rows we sample is not fixed; instead, we use a statistical approach called the Poisson distribution. This involves picking rows randomly from an infinite pool of rows with uniform random sampling. Importantly, we don't need to perform a full diff (compare every single row) to establish a baseline.
Example: Imagine there are two datasets we want to compare, Main and Test. Since we prefer not to check every row, we use a statistical approach to determine the number of rows to sample from each dataset. To do so, we set the following parameters:
* Sampling tolerance: 5%
* Sampling confidence: 95%
Sampling confidence reflects our level of certainty that our sample accurately represents the entire dataset, while sampling tolerance defines the allowable margin of error for our estimate. Here, with a 95% sampling confidence and a 5% sampling tolerance, we are 95% confident that the true value falls within 5% of our estimate. Datafold will then estimate the sample size needed (e.g., 200 rows) to achieve these parameters.
##### % of rows
Percent of rows sampling defines the proportion of the dataset to be included in the sample by specifying a percentage of the total number of rows. For example, setting the sampling percentage to 0.1% means that only 0.1% of the total rows will be sampled for analysis or comparison.
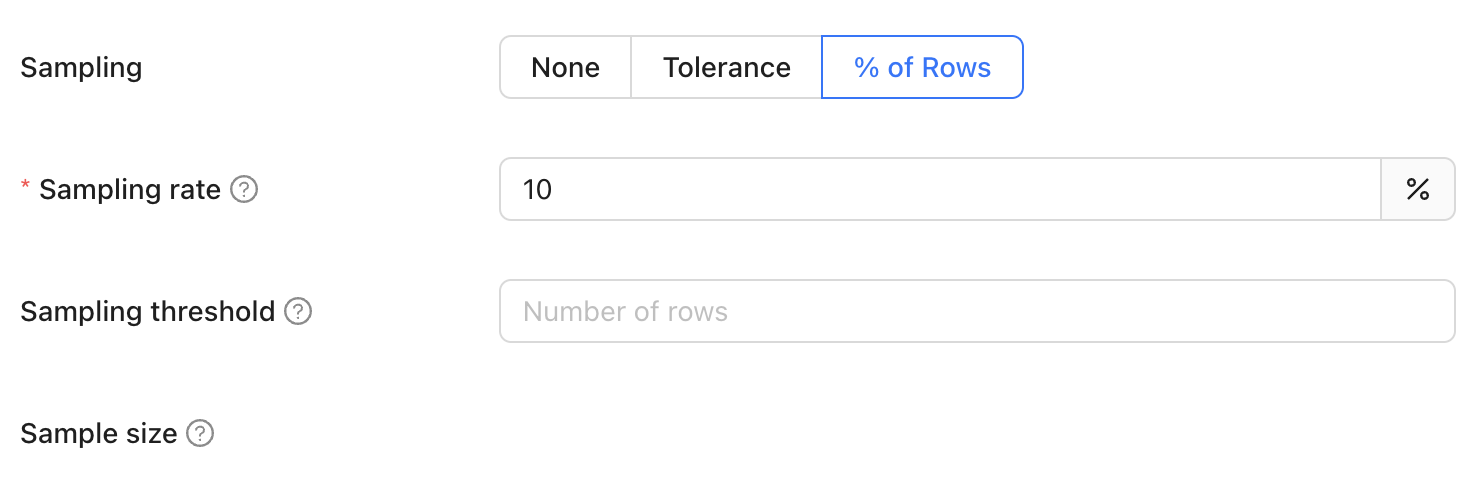 When percent of rows sampling is enabled, a fixed percentage of rows is selected randomly from the dataset. This method simplifies the sampling process, making it easy to understand and configure without needing to adjust complex statistical parameters. However, it lacks the statistical assurances provided by methods like sampling tolerance.
It doesn't dynamically adjust based on data characteristics or discrepancies but rather adheres strictly to the specified percentage, regardless of the dataset's variability. This straightforward approach is ideal for scenarios where simplicity and quick setup are more important than precision and statistical confidence. It provides a basic yet effective way to estimate the dataset's characteristics or differences, suitable for less critical data validation tasks.
###### Sampling rate
This refers to the percentage of the total number of rows in the largest table that will be used to determine the sample size. This ensures that the sample size is proportionate to the size of the dataset, providing a representative subset for comparison. For instance, if the largest table contains 1,000,000 rows and the sampling rate is set to 1%, the sample size will be 10,000 rows.
###### Sampling threshold
Sampling is automatically disabled when the total row count of the largest table in the comparison falls below a specified threshold value. This approach is adopted because, for smaller datasets, a complete dataset comparison is not only more feasible but also quicker and more efficient than sampling. Disabling sampling in these scenarios ensures comprehensive data coverage and provides more accurate insights, as it becomes practical to examine every row in the dataset without significant time or resource constraints.
###### Sampling size
This parameter is the [same one used in sampling tolerance](#sample-size).
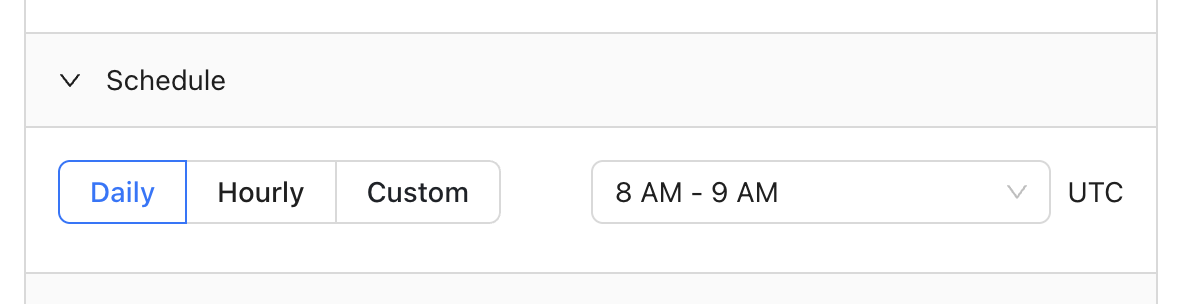
### Add a schedule
You can choose to run your monitor daily, hourly, or even input a cron expression for more complex scheduling:
When percent of rows sampling is enabled, a fixed percentage of rows is selected randomly from the dataset. This method simplifies the sampling process, making it easy to understand and configure without needing to adjust complex statistical parameters. However, it lacks the statistical assurances provided by methods like sampling tolerance.
It doesn't dynamically adjust based on data characteristics or discrepancies but rather adheres strictly to the specified percentage, regardless of the dataset's variability. This straightforward approach is ideal for scenarios where simplicity and quick setup are more important than precision and statistical confidence. It provides a basic yet effective way to estimate the dataset's characteristics or differences, suitable for less critical data validation tasks.
###### Sampling rate
This refers to the percentage of the total number of rows in the largest table that will be used to determine the sample size. This ensures that the sample size is proportionate to the size of the dataset, providing a representative subset for comparison. For instance, if the largest table contains 1,000,000 rows and the sampling rate is set to 1%, the sample size will be 10,000 rows.
###### Sampling threshold
Sampling is automatically disabled when the total row count of the largest table in the comparison falls below a specified threshold value. This approach is adopted because, for smaller datasets, a complete dataset comparison is not only more feasible but also quicker and more efficient than sampling. Disabling sampling in these scenarios ensures comprehensive data coverage and provides more accurate insights, as it becomes practical to examine every row in the dataset without significant time or resource constraints.
###### Sampling size
This parameter is the [same one used in sampling tolerance](#sample-size).
### Add a schedule
You can choose to run your monitor daily, hourly, or even input a cron expression for more complex scheduling:
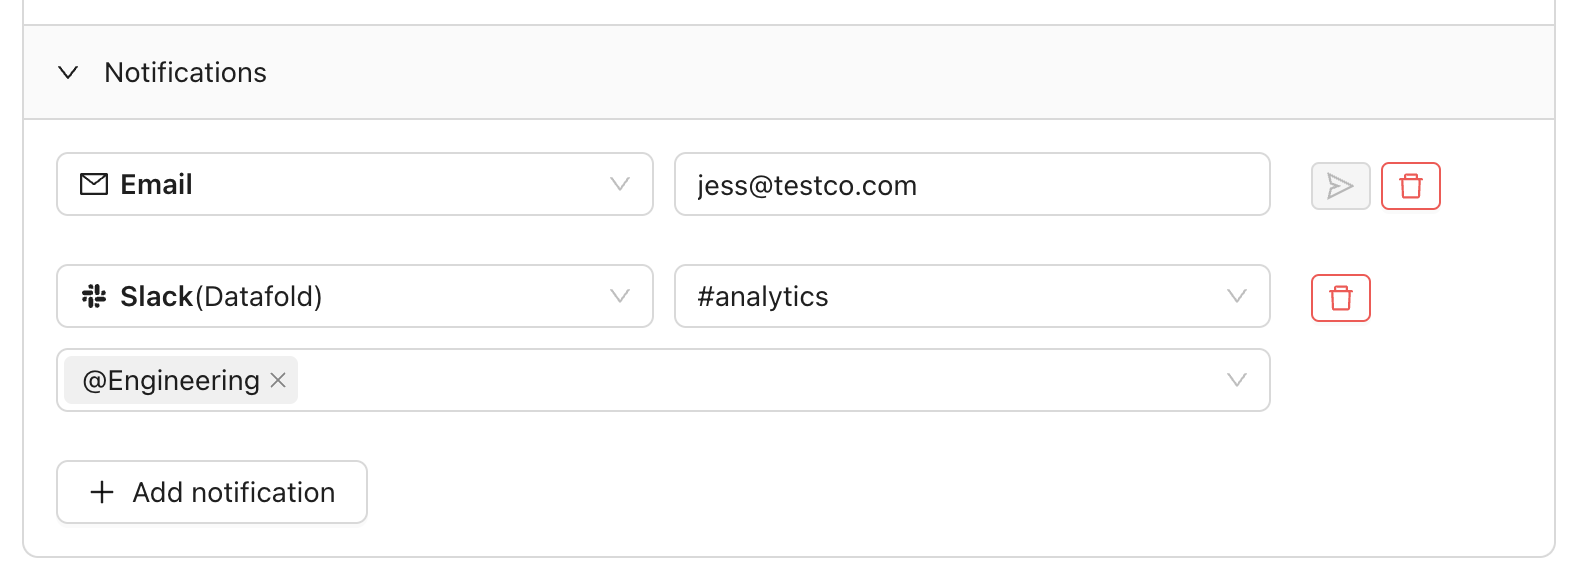
 ### Add notifications
You can add notifications, sent through Slack or emails, which indicate whether a monitor has been executed.
Notifications are sent when either or both predefined thresholds are reached during a Diff Monitor. You can set a maximum threshold for the:
* Number of different rows
* Percentage of different rows
### Add notifications
You can add notifications, sent through Slack or emails, which indicate whether a monitor has been executed.
Notifications are sent when either or both predefined thresholds are reached during a Diff Monitor. You can set a maximum threshold for the:
* Number of different rows
* Percentage of different rows
 ## Results
The diff monitor run history shows the results from each run.
## Results
The diff monitor run history shows the results from each run.
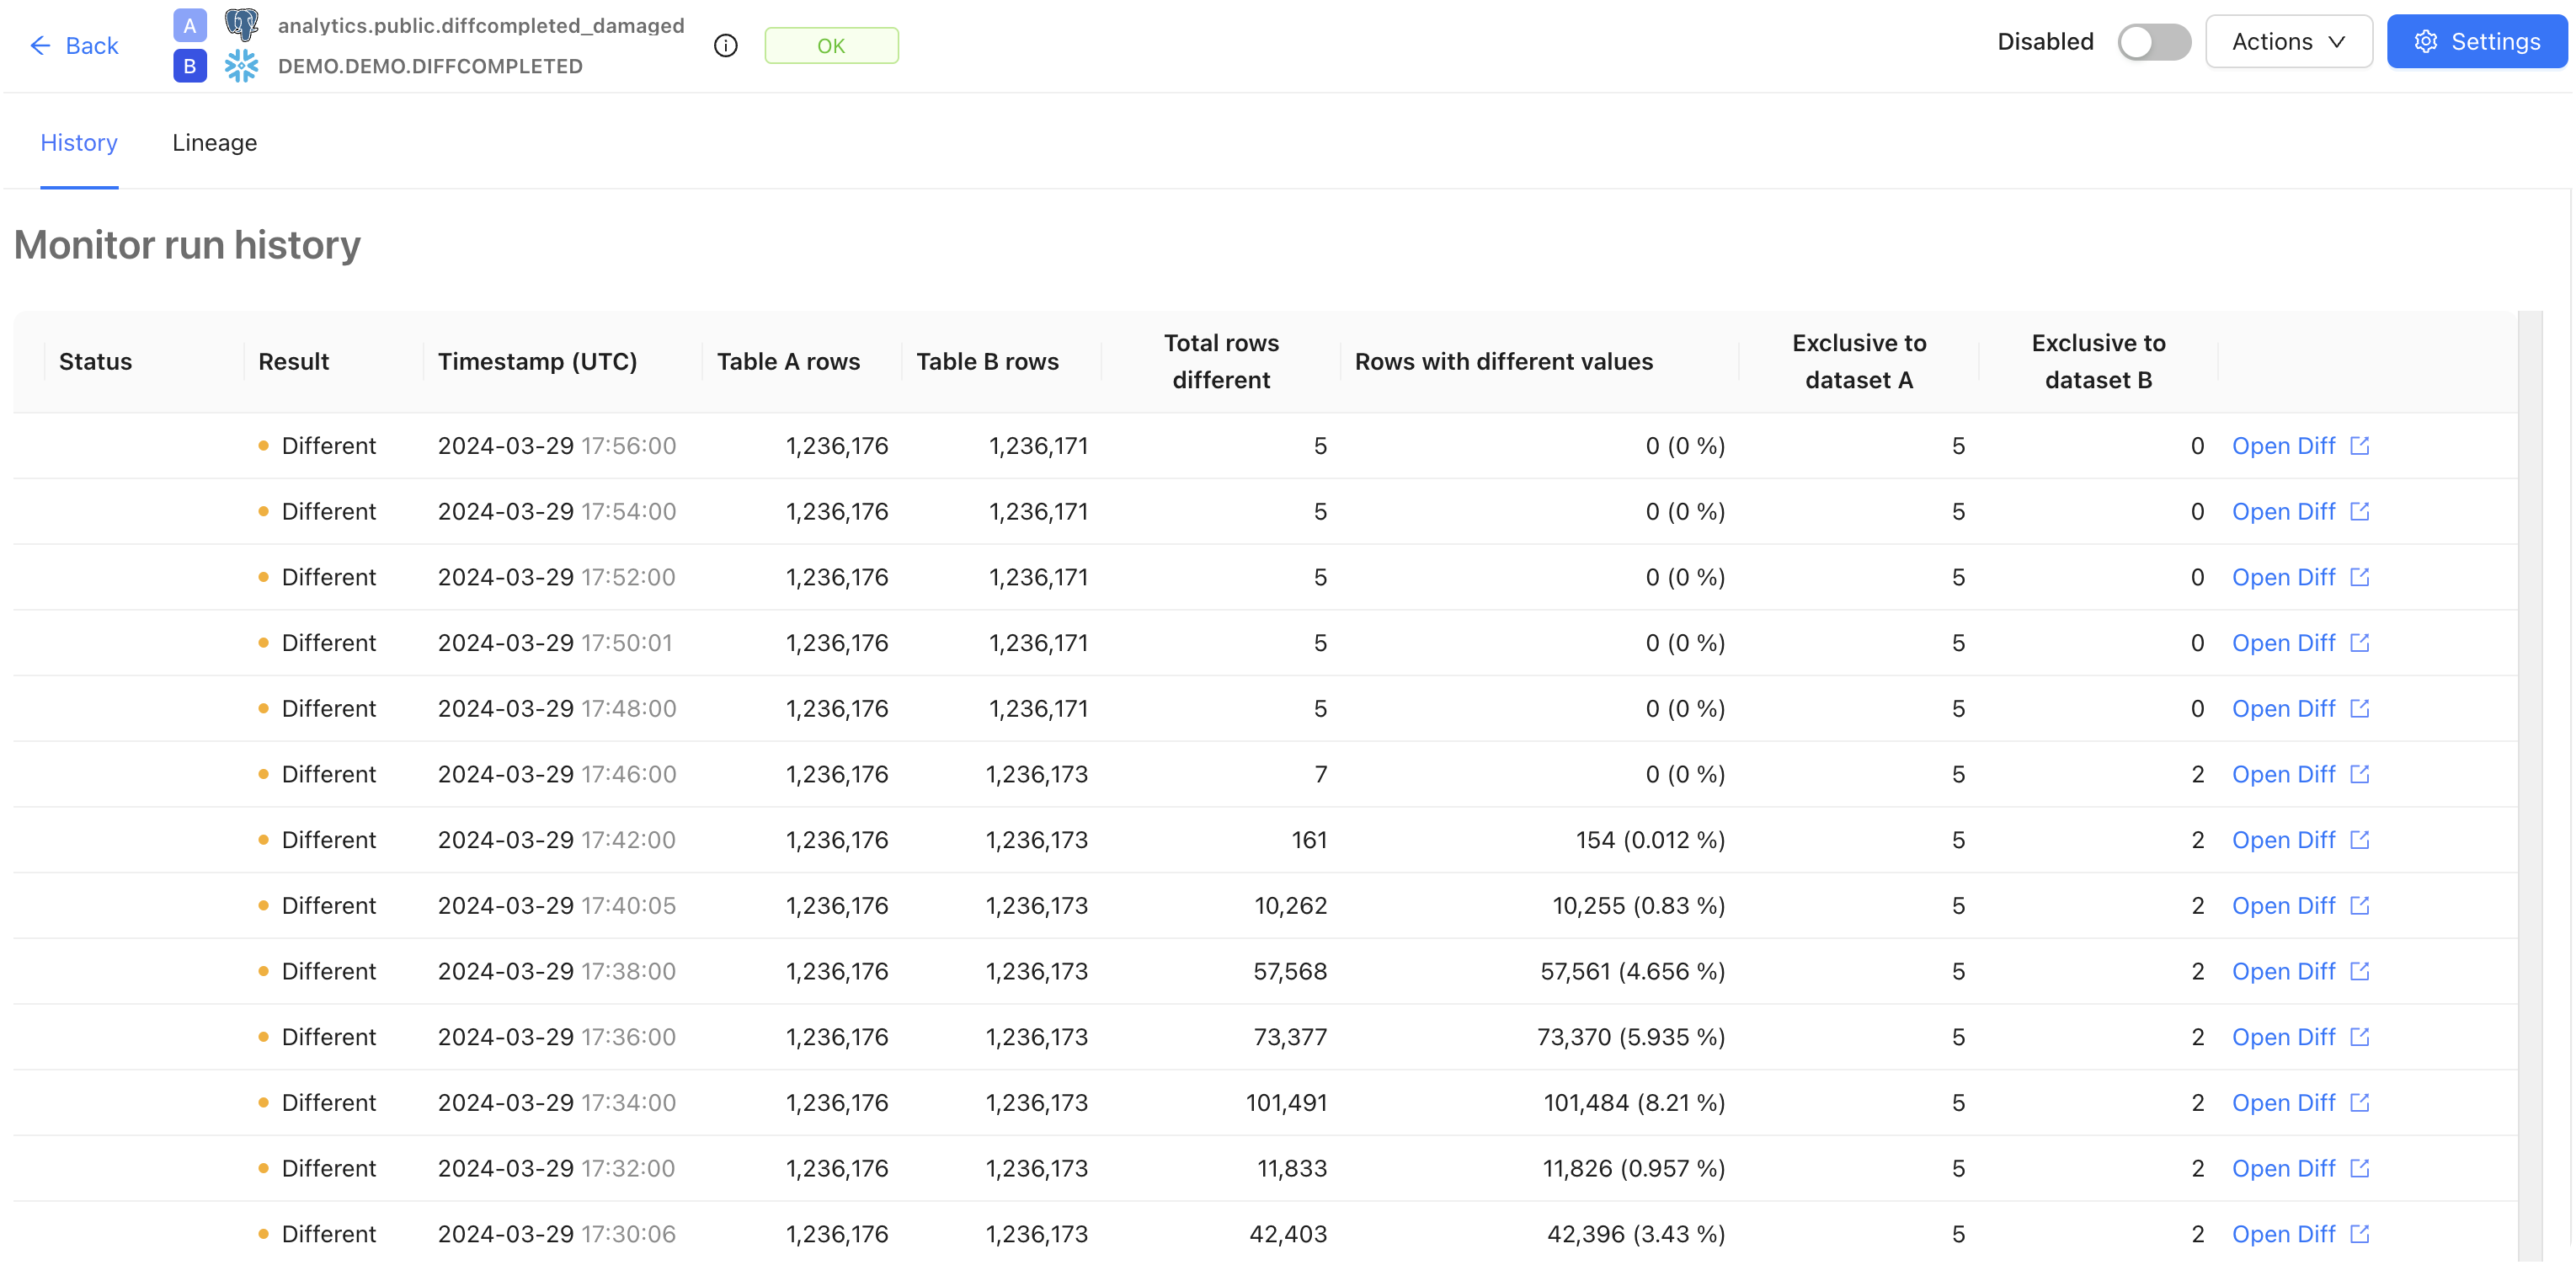 Each run includes basic stats, along with metrics such as:
* The total rows different: number of different rows according to data diff results.
* Rows with different values: percentage of different rows relative to the total number of rows in dataset A according to data diff results. Note that the status `Different` doesn't automatically map into a notification/alert.
Click the **Open Diff** link for more granular information about a specific Data Diff.
## FAQ
Use sampling tolerance when you need statistical confidence in your results, as it is more efficient and stops sampling once a difference is confidently detected. This method is ideal for critical data validation tasks that require precise accuracy.
On the other hand, use the percent of rows method for its simplicity and ease of use, especially in less critical scenarios where you just need a straightforward, quick sampling approach without worrying about statistical parameters. This method is perfect for general, easy-to-understand sampling needs.
If you have any questions about how to use Data Diff monitors, please reach out to our team via Slack, in-app chat, or email us at [support@datafold.com](mailto:support@datafold.com).
Each run includes basic stats, along with metrics such as:
* The total rows different: number of different rows according to data diff results.
* Rows with different values: percentage of different rows relative to the total number of rows in dataset A according to data diff results. Note that the status `Different` doesn't automatically map into a notification/alert.
Click the **Open Diff** link for more granular information about a specific Data Diff.
## FAQ
Use sampling tolerance when you need statistical confidence in your results, as it is more efficient and stops sampling once a difference is confidently detected. This method is ideal for critical data validation tasks that require precise accuracy.
On the other hand, use the percent of rows method for its simplicity and ease of use, especially in less critical scenarios where you just need a straightforward, quick sampling approach without worrying about statistical parameters. This method is perfect for general, easy-to-understand sampling needs.
If you have any questions about how to use Data Diff monitors, please reach out to our team via Slack, in-app chat, or email us at [support@datafold.com](mailto:support@datafold.com).