> ## Documentation Index
> Fetch the complete documentation index at: https://docs.datafold.com/llms.txt
> Use this file to discover all available pages before exploring further.
# How It Works
> Datafold's Data Knowledge Graph maps your entire data ecosystem — lineage, business logic, usage, and ontology — providing essential context to your AI agents via MCP and helping you understand the impact of changes across systems.
Our **Data Explorer** offers a comprehensive overview of your data assets, including [Lineage](/data-explorer/lineage) and [Profiles](/data-explorer/profile). It is powered by the **Data Knowledge Graph (DKG)**, which automatically collects and unifies information about your data, analytical products, and data infrastructure — serving it to your AI agents via [MCP](/datafold-mcp) to provide essential context for any data-related task.
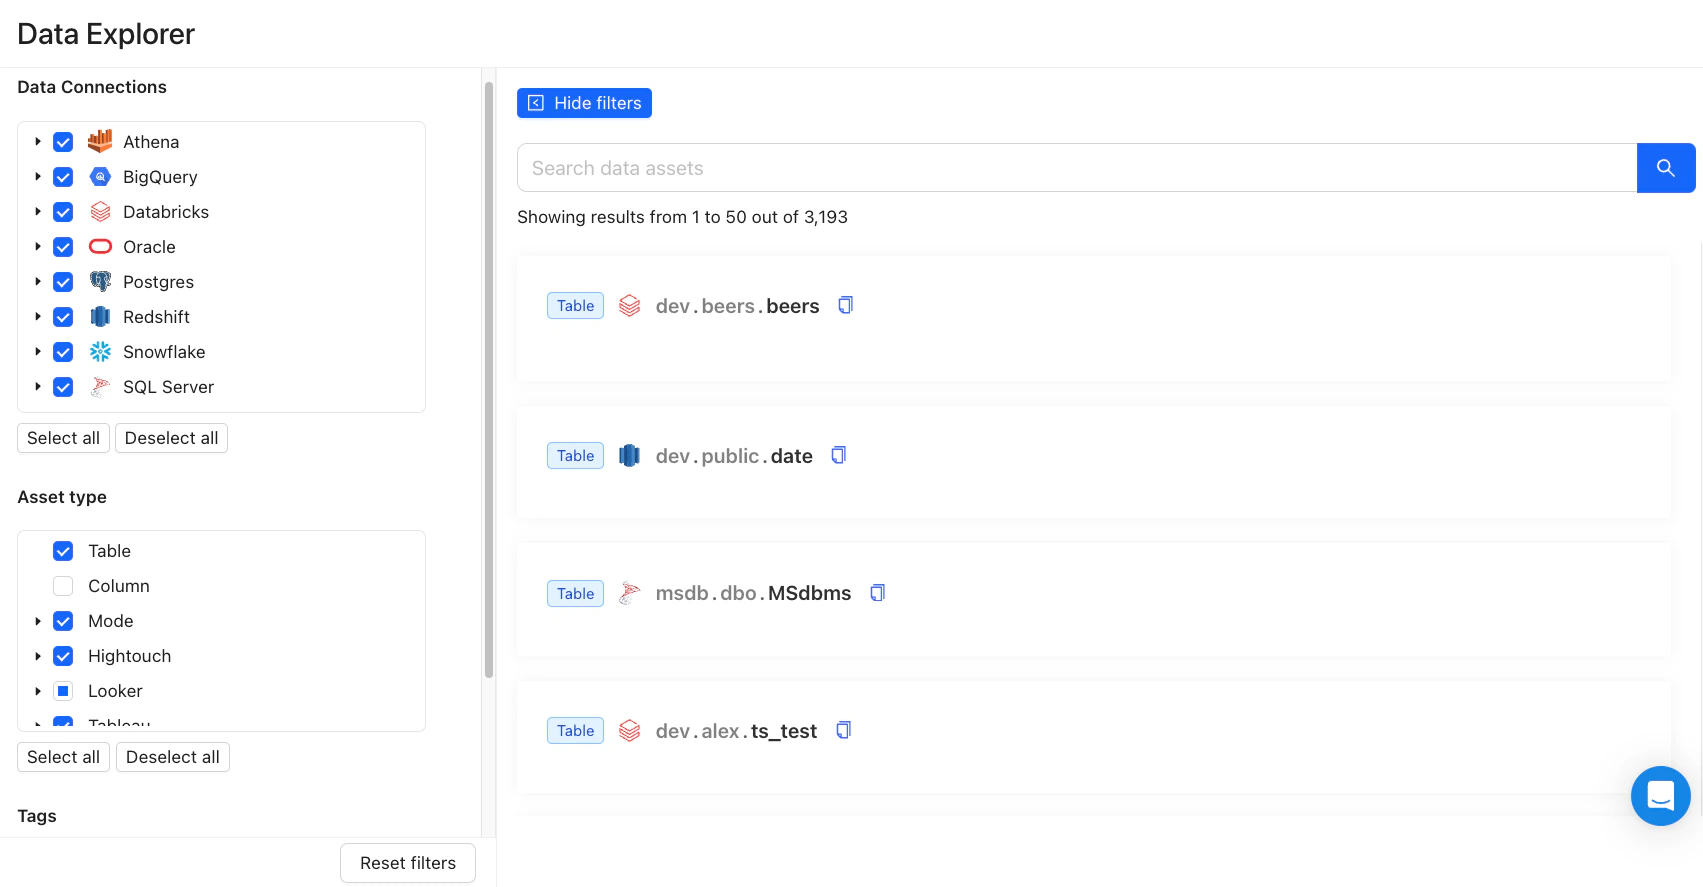
You can filter data assets by Data Connections, Tags, Data Owners, and Asset Types (e.g., tables, columns, and BI-created assets such as views, reports, and syncs). You can also search directly to find specific data assets for lineage analysis.
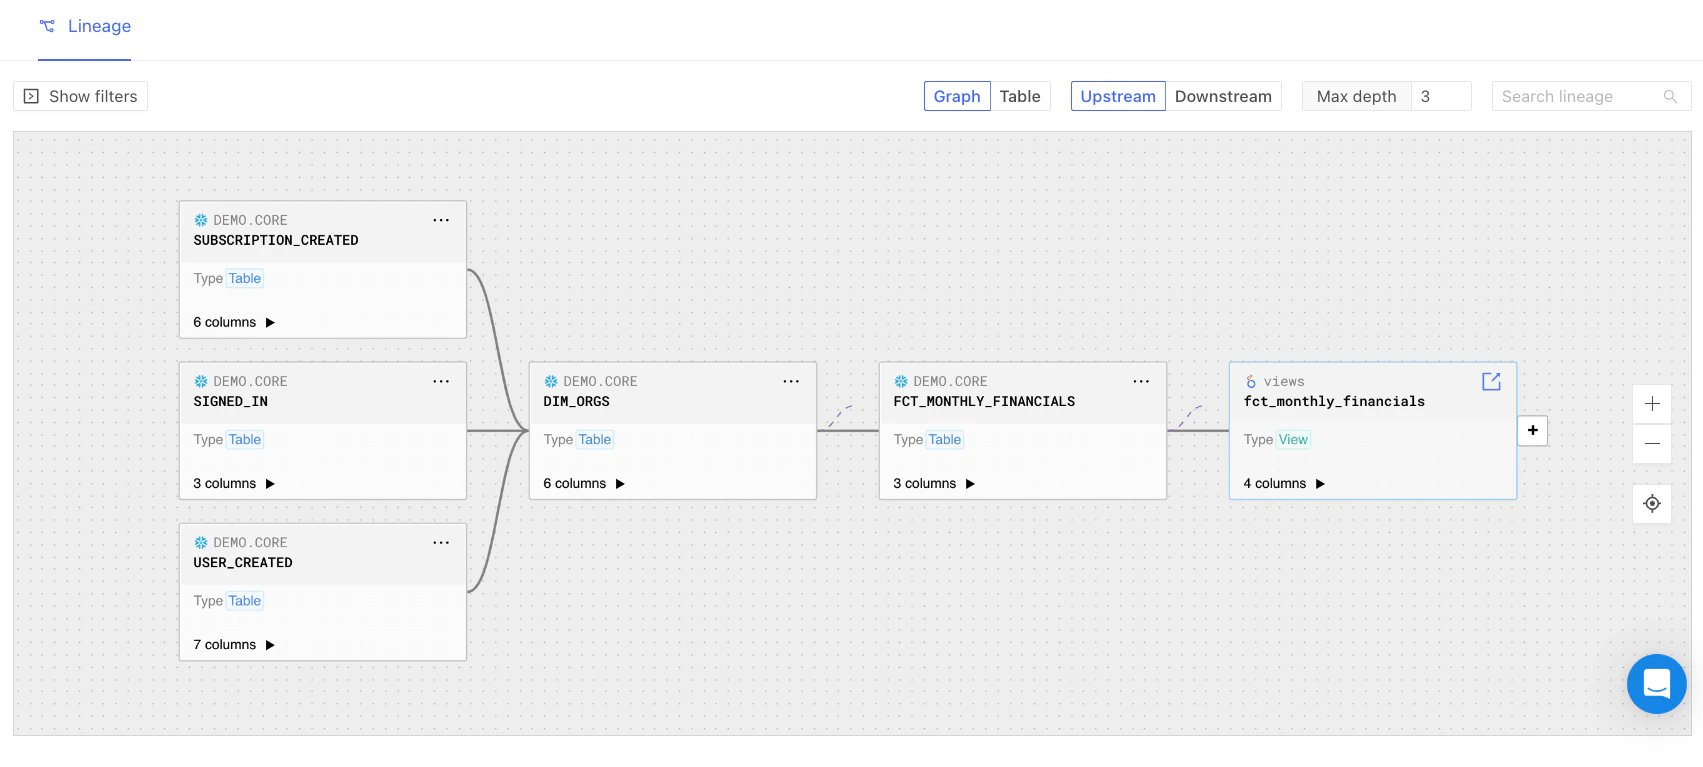
 After selecting a table or data asset, the UI will display a **graph of table-level lineage** by default. You can toggle between **Upstream** and **Downstream** perspectives and customize the lineage view by adjusting the **Max Depth** parameter to your preference.